Infrastructure monitoring built for high-cardinality efficiency at scale
Elastic gives you full-stack observability into your infrastructure, identifies anomalies, investigates root causes, and automates remediation — all powered by AI — so you can plan capacity and resolve issues faster. Columnar storage keeps performance high and costs low.


Fully loaded with AI, everywhere you already work
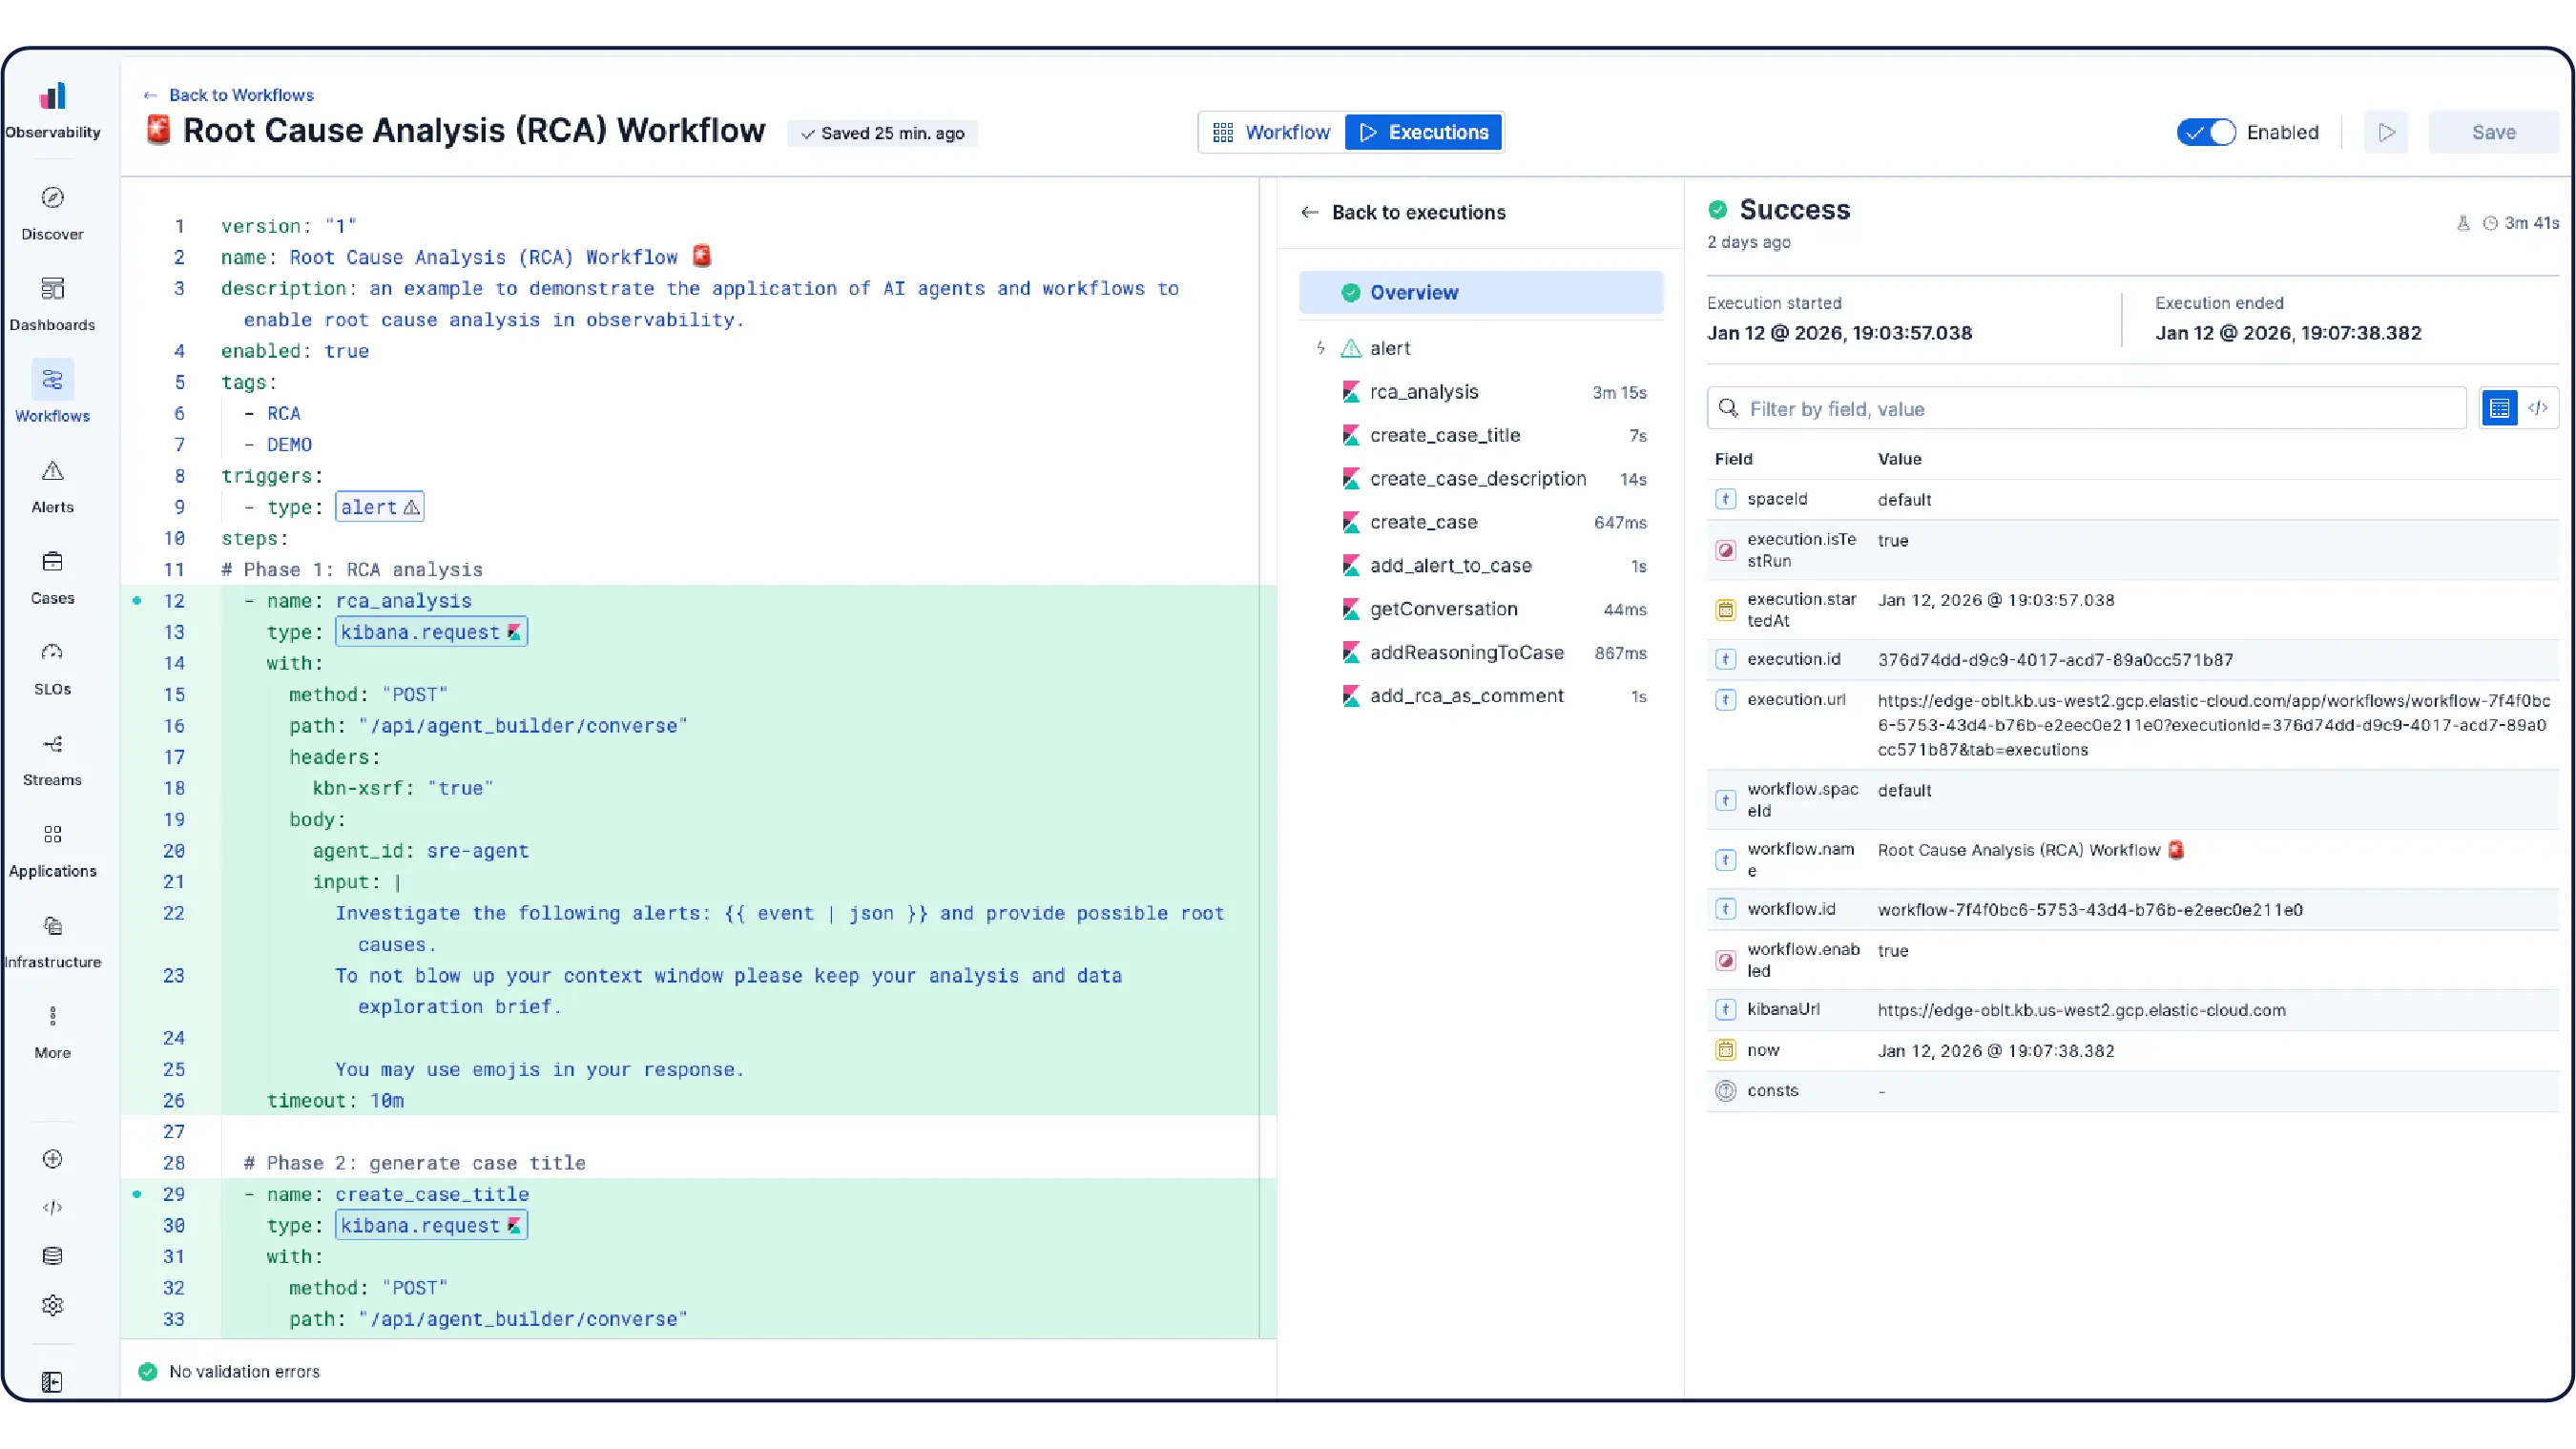
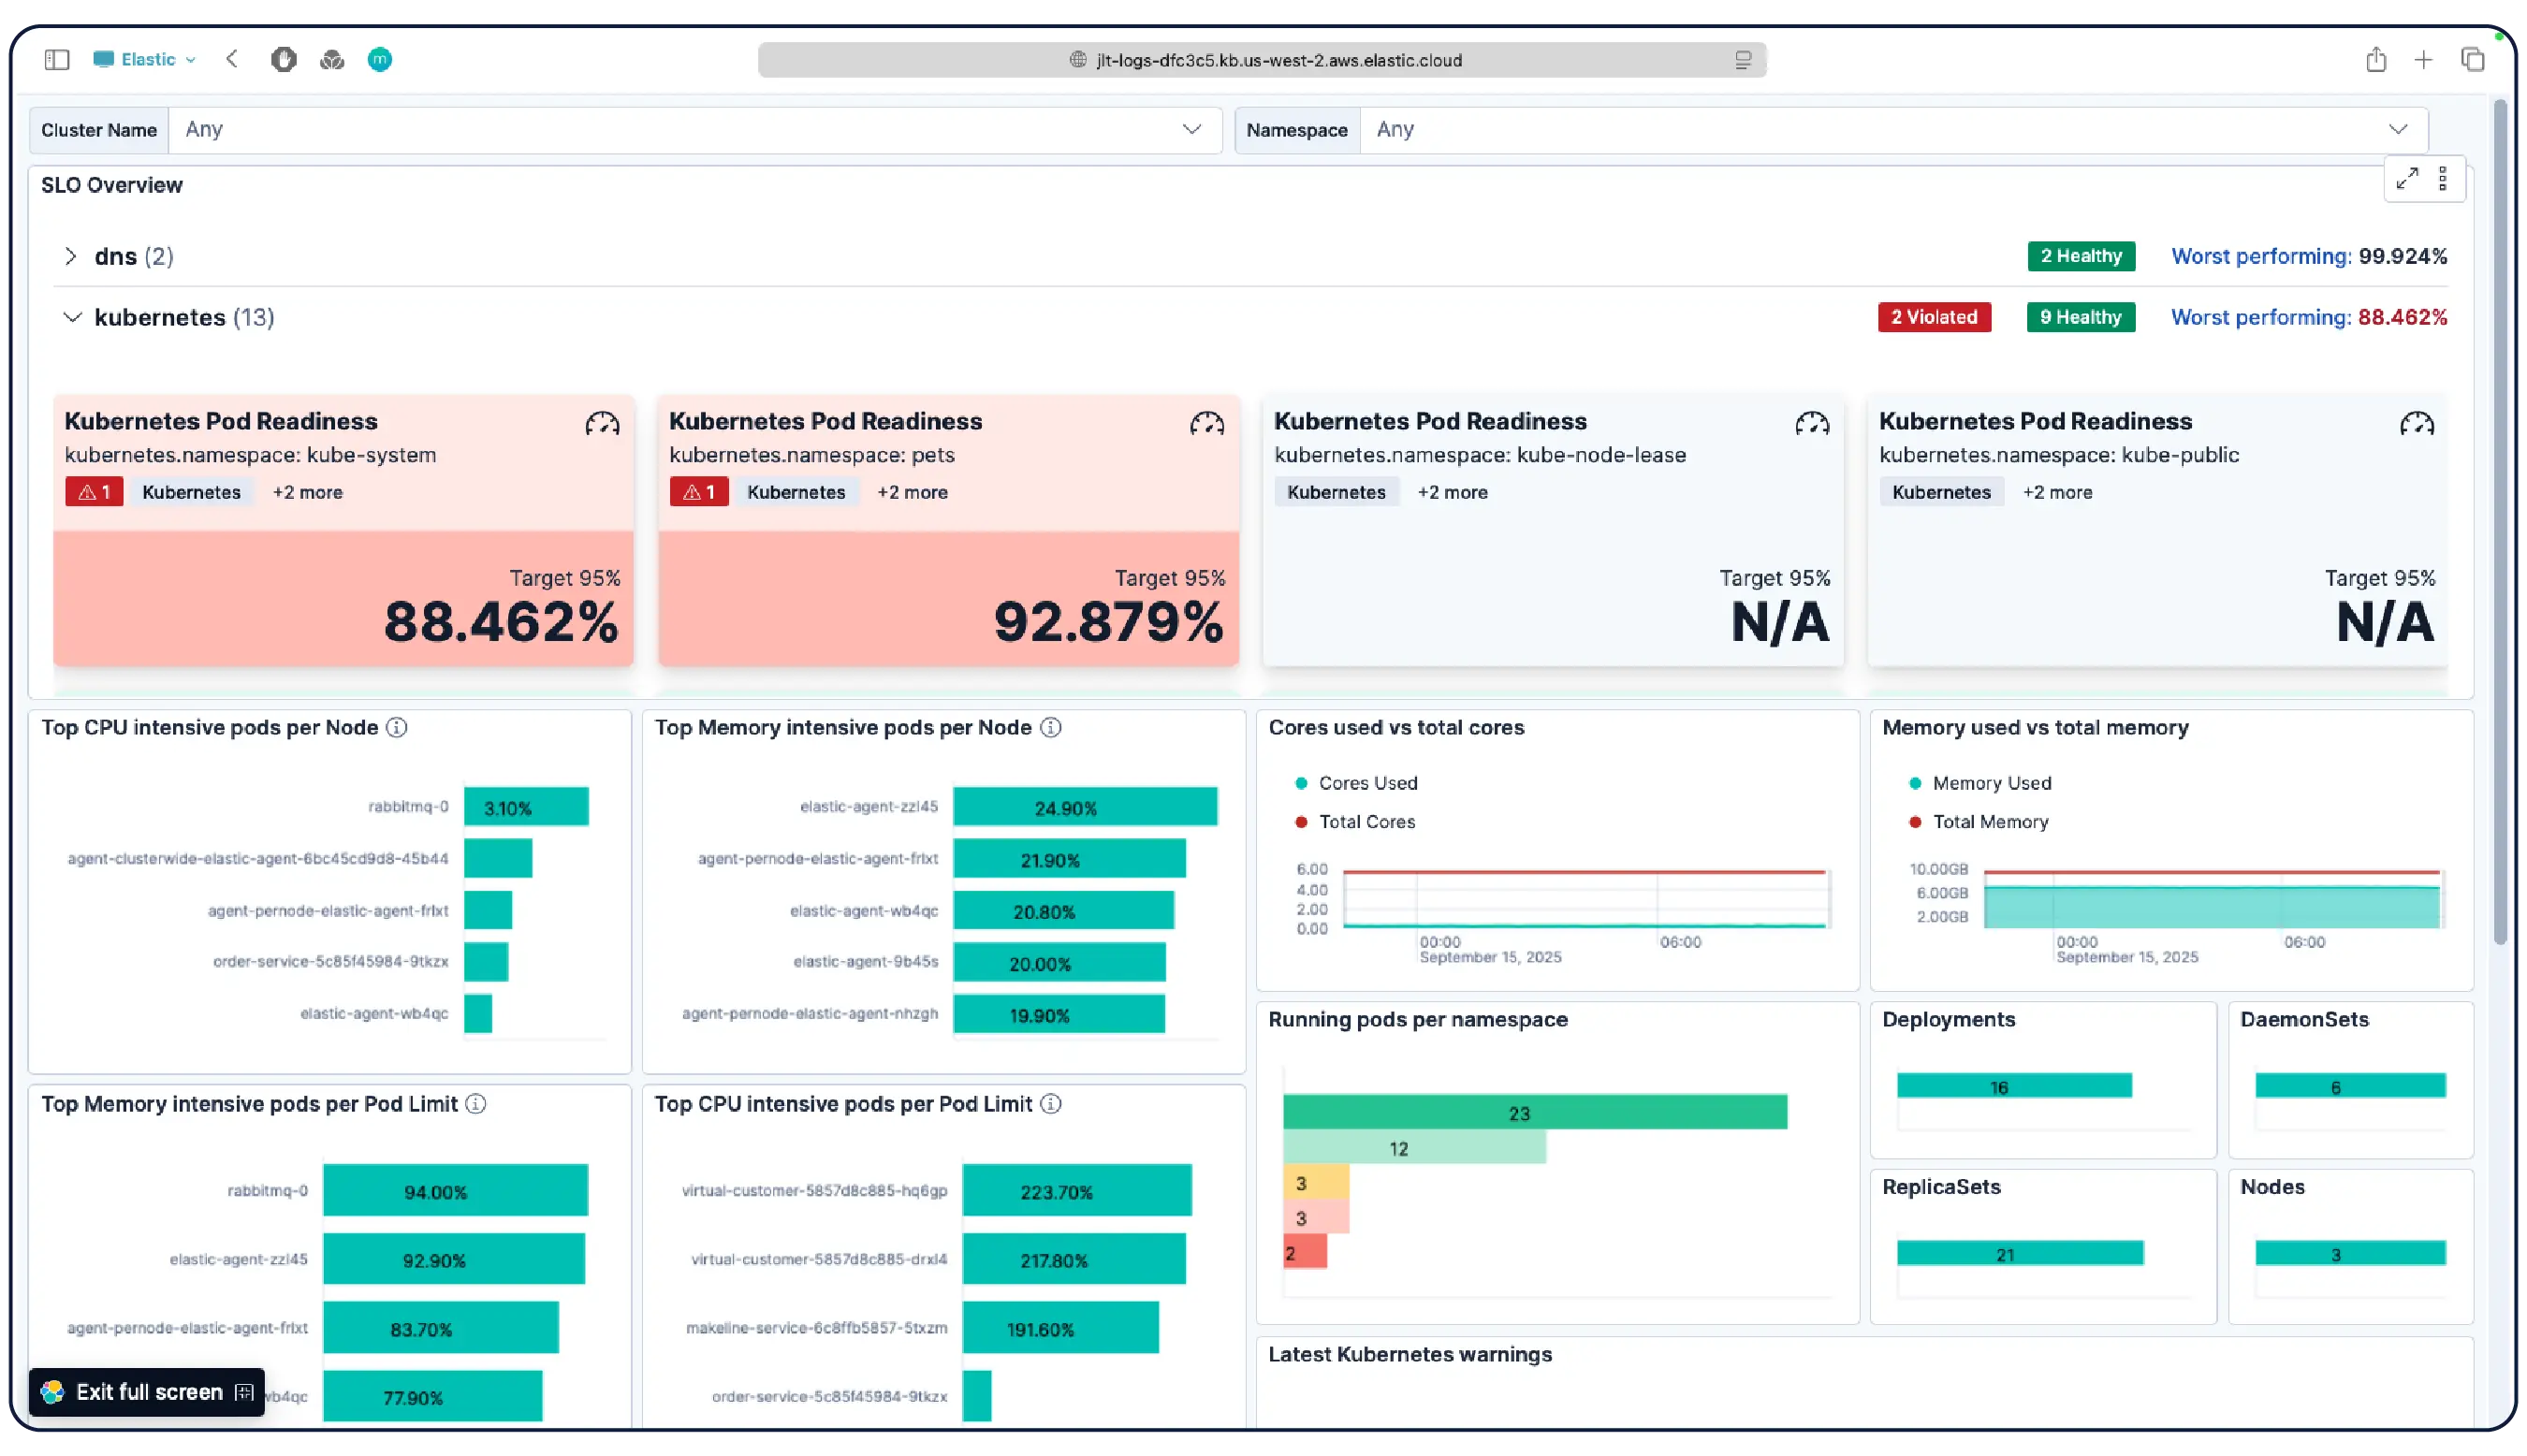
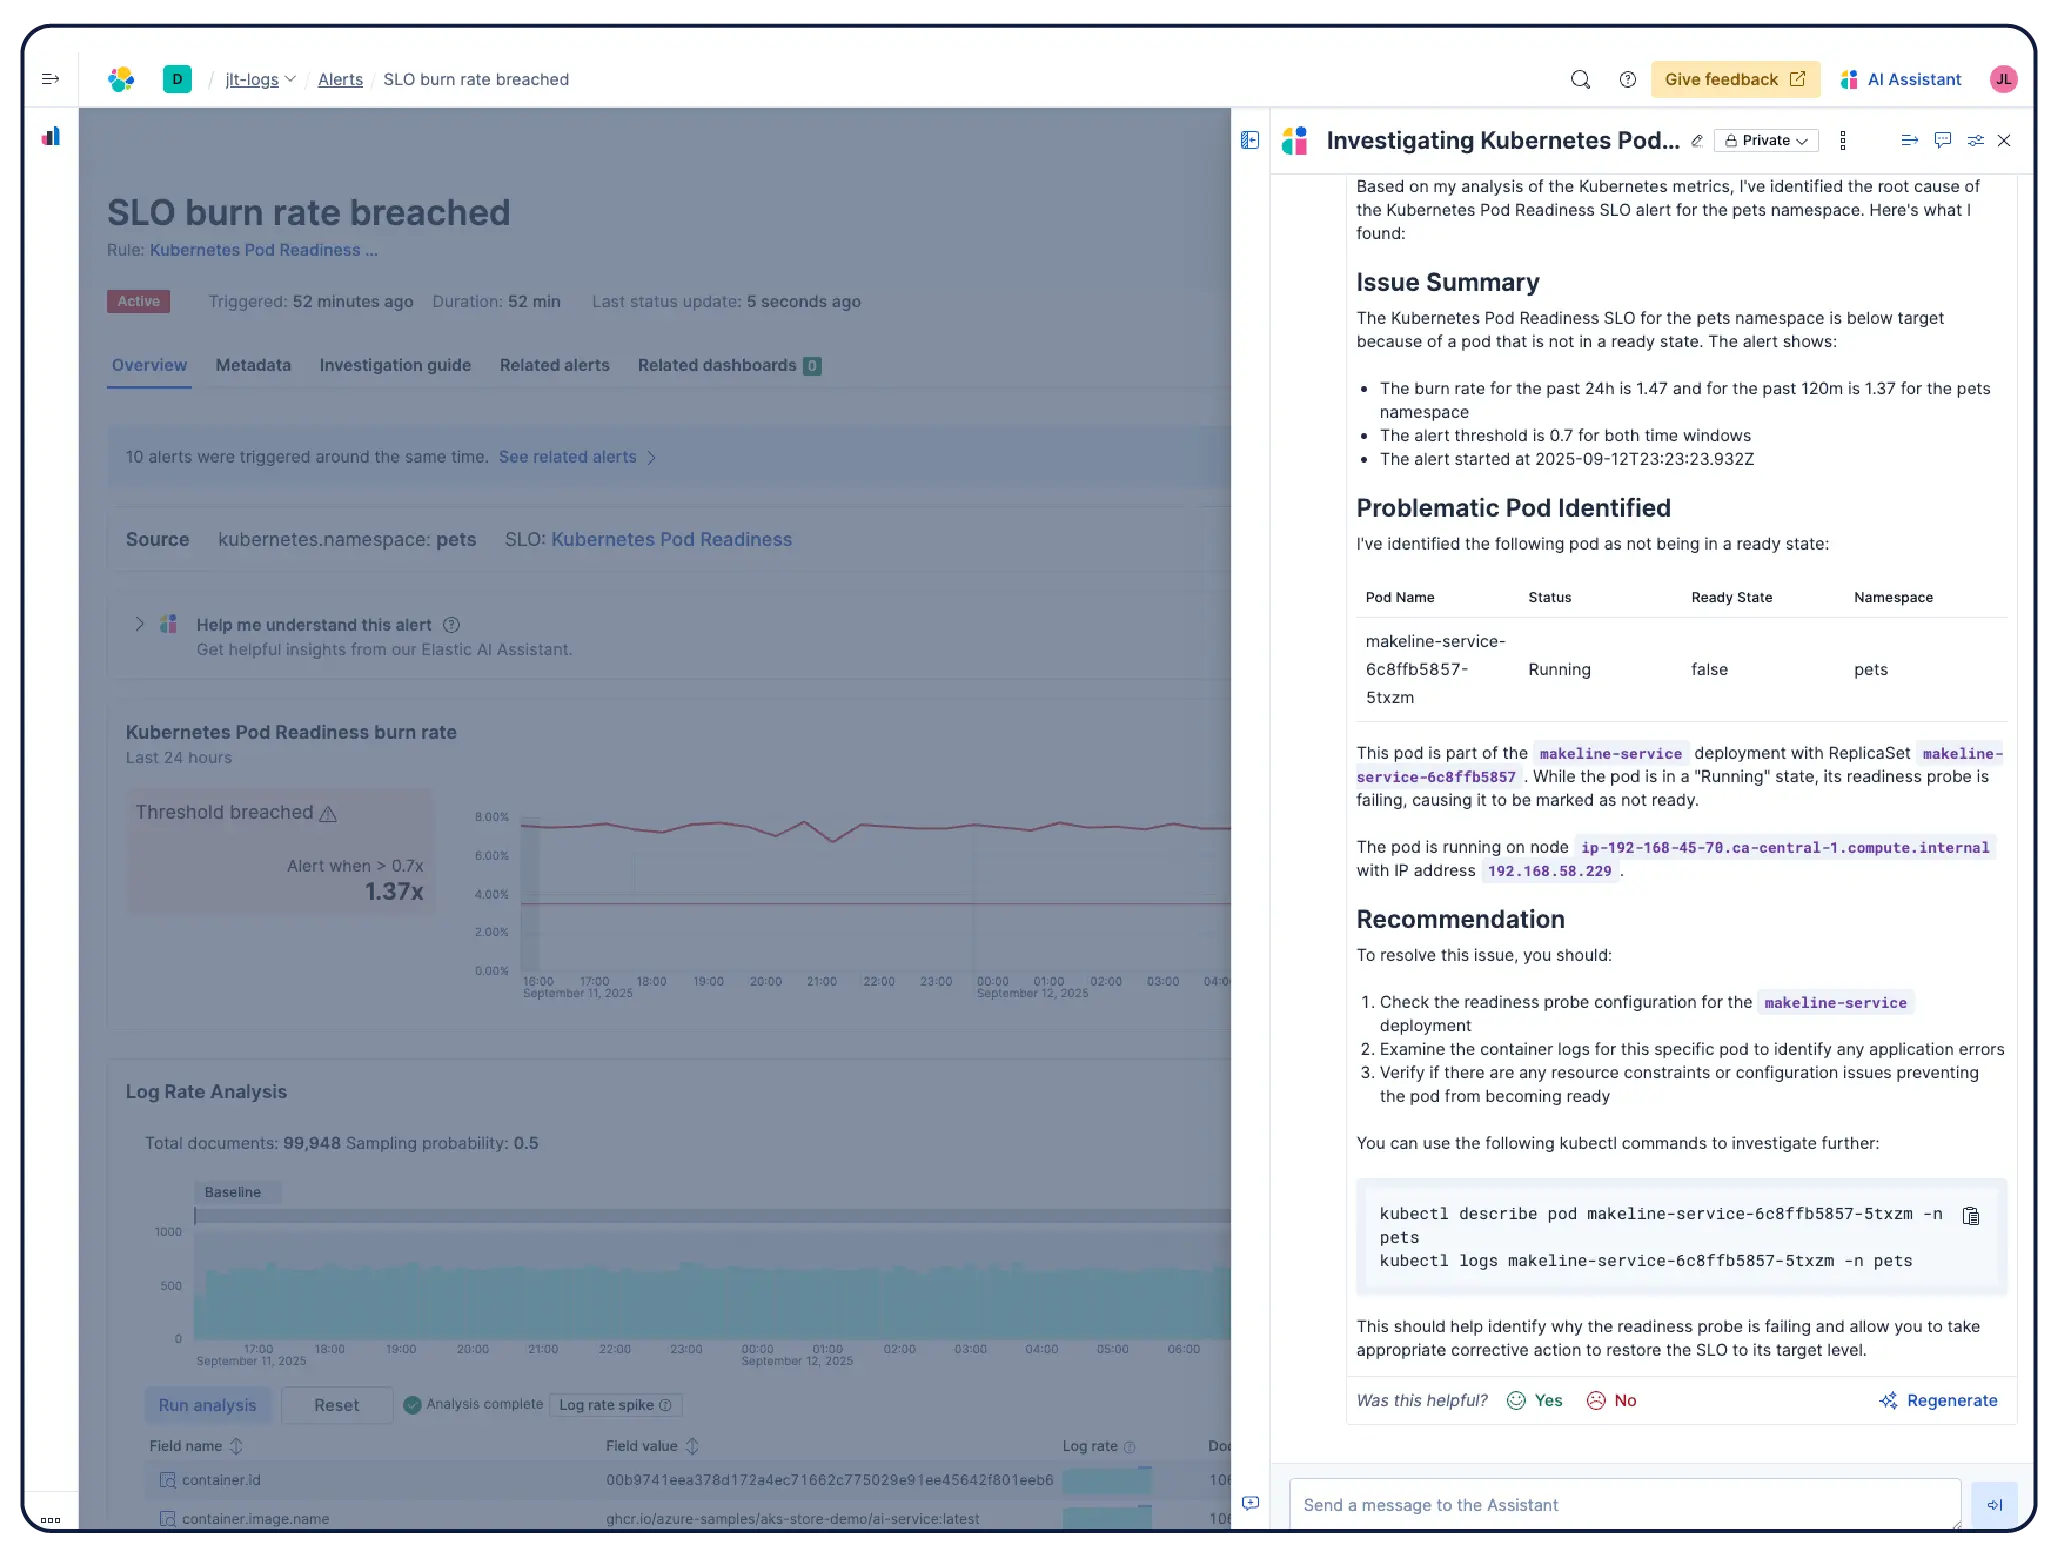
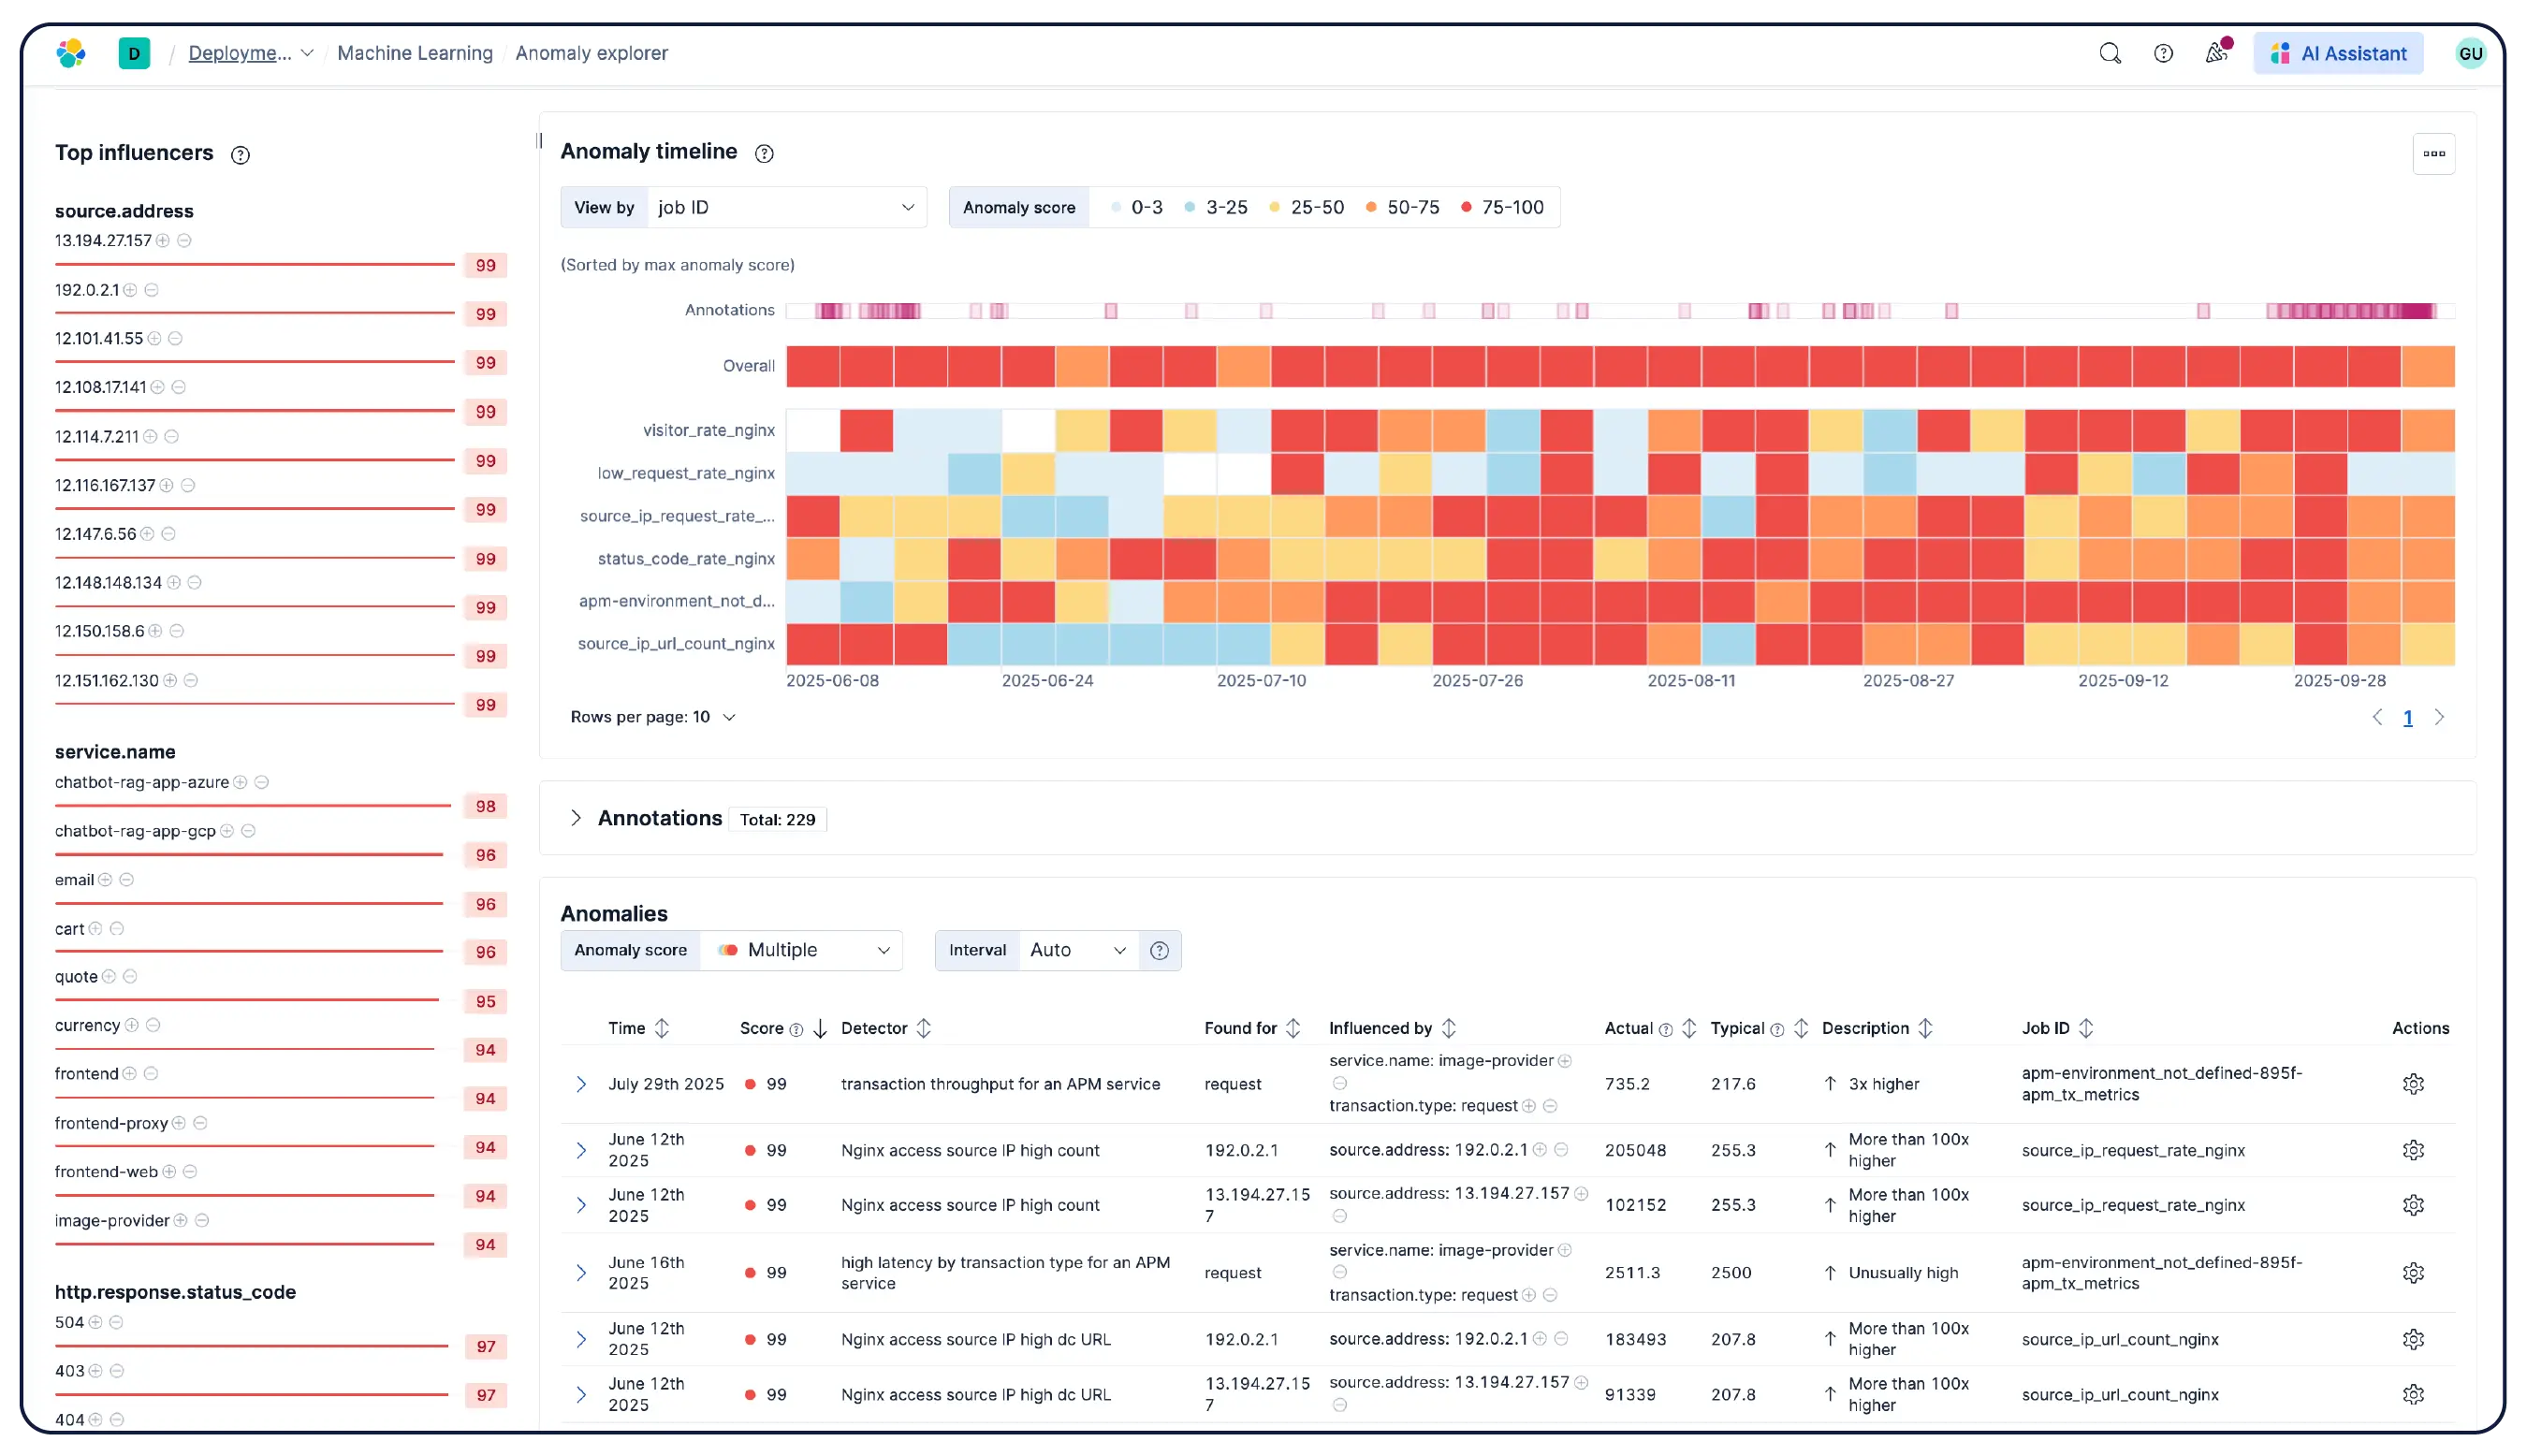
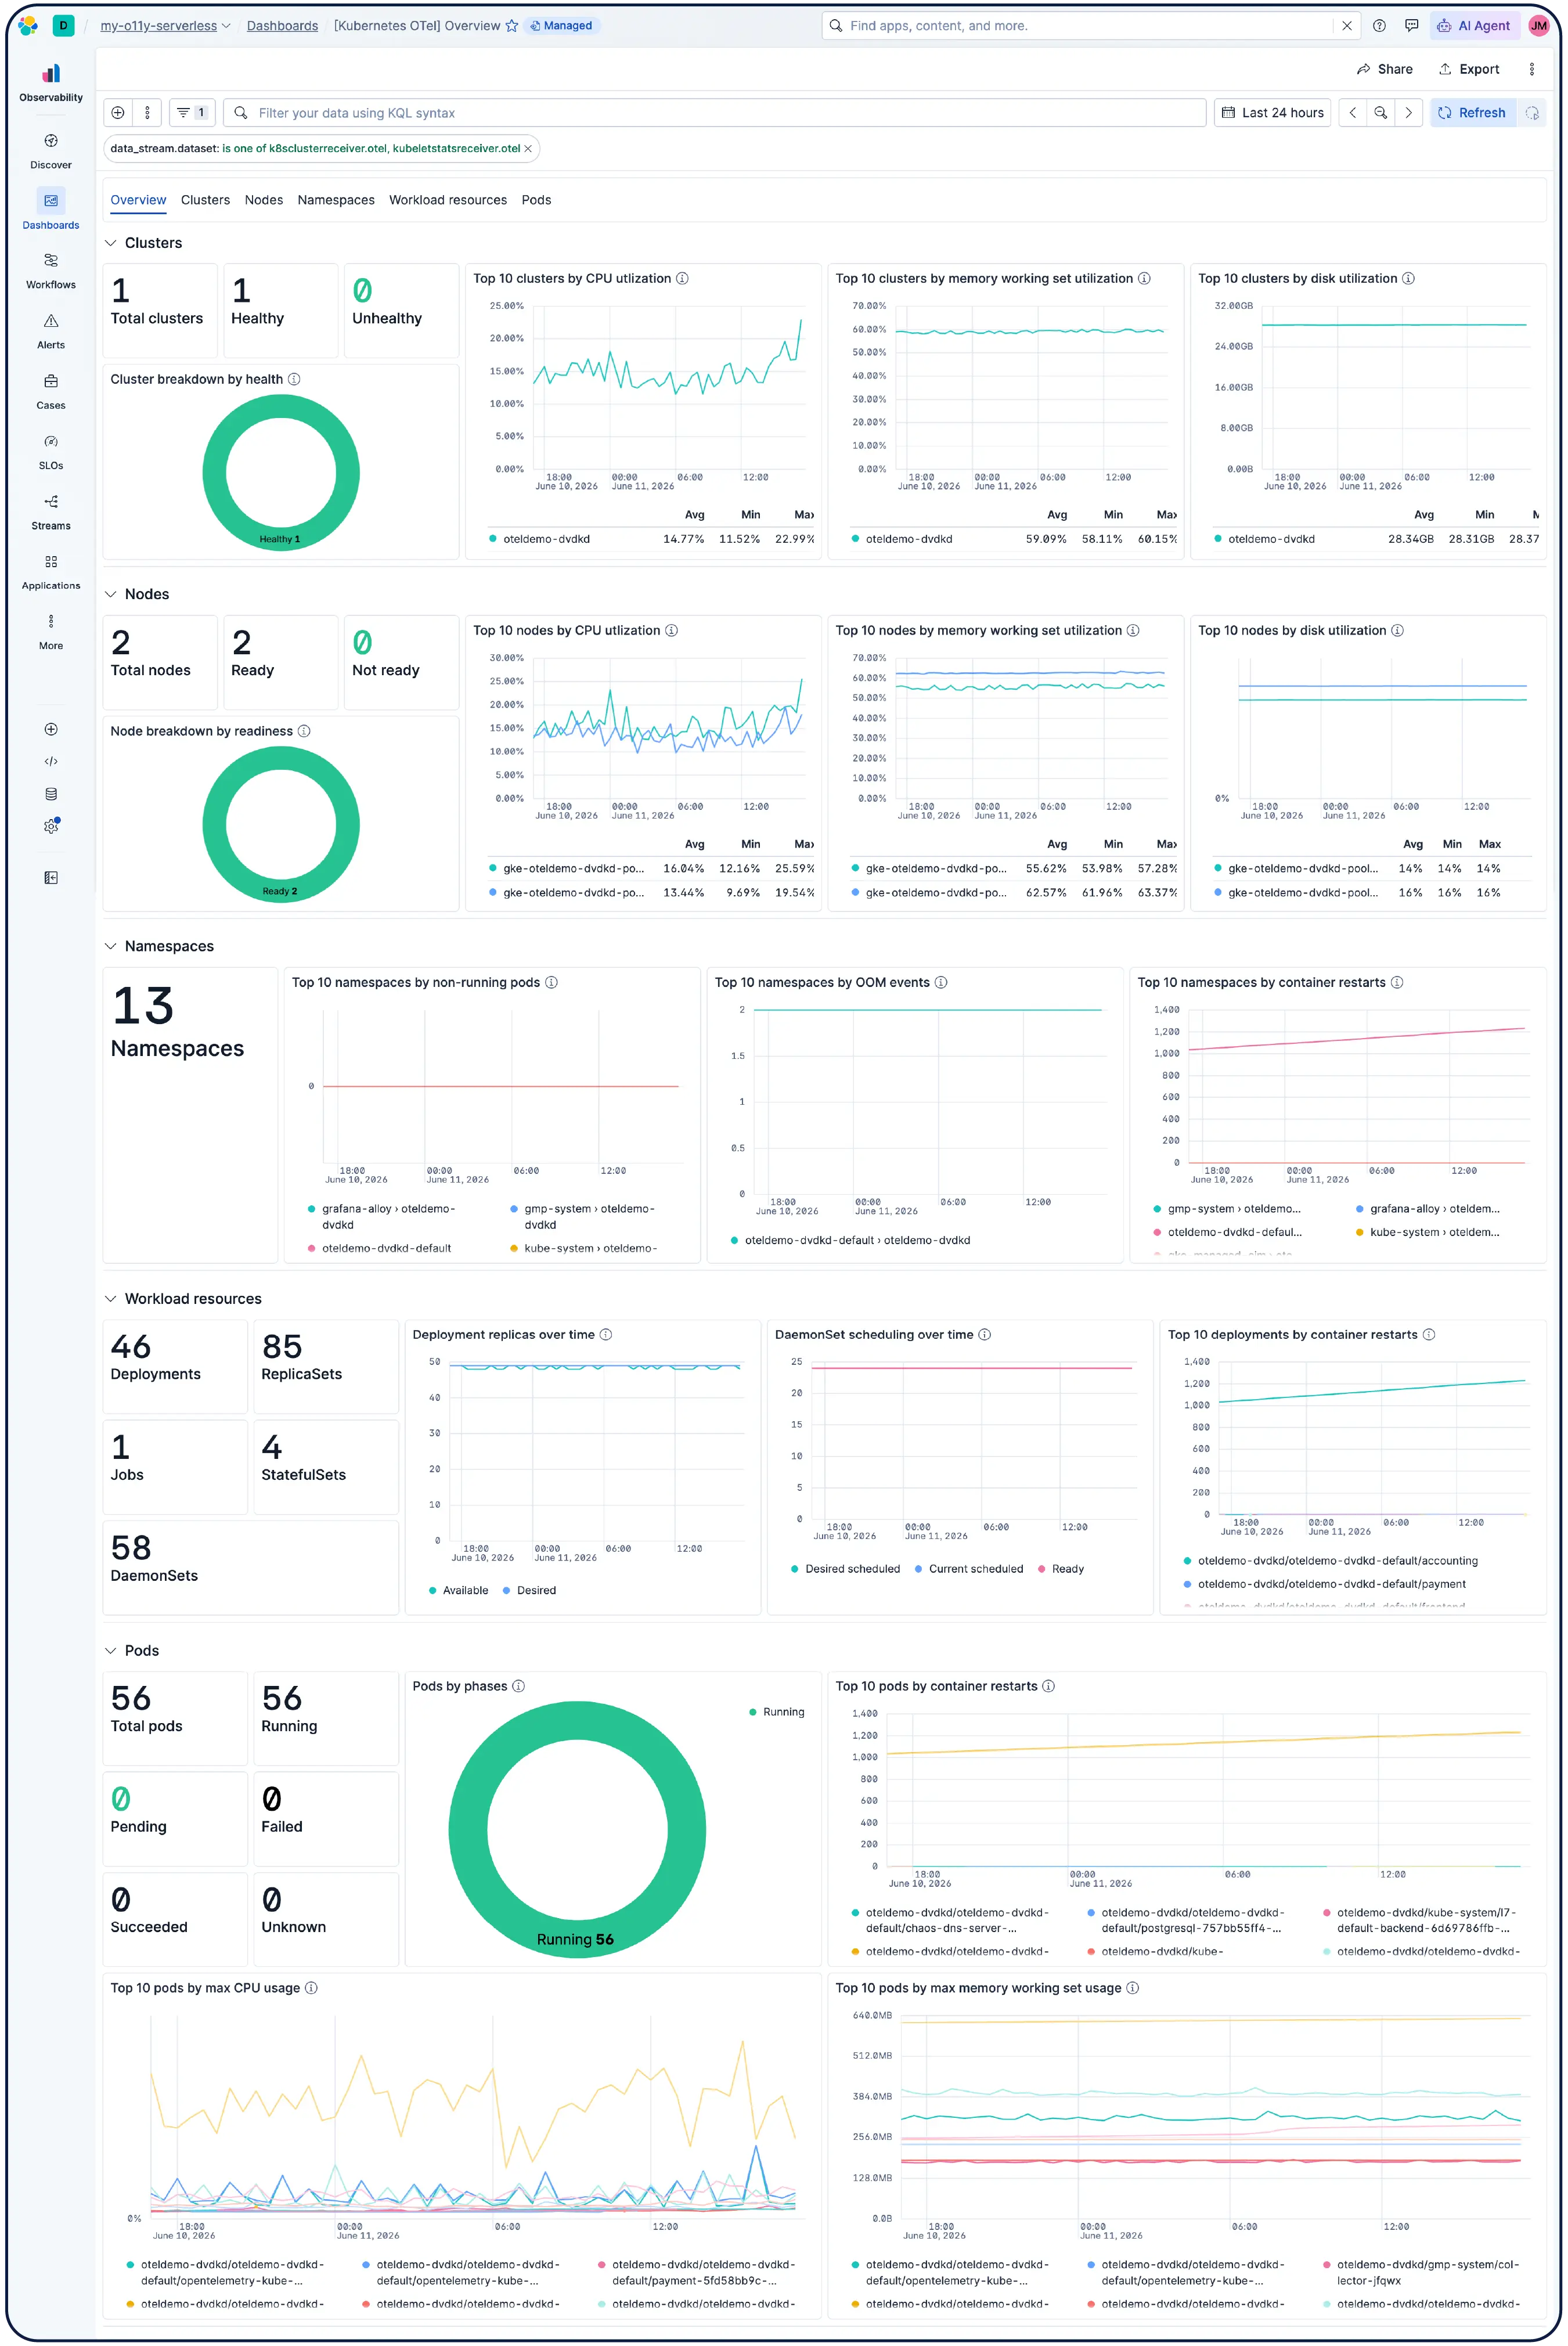
Get a working setup ready to use the moment you connect. Elastic's Kubernetes monitoring ships complete with preconfigured dashboards, alerts, SLOs, and machine learning jobs included, as well as agent skills and an MCP app for health monitoring, anomaly detection, incident investigations, and remediation.

Best-in-class efficiency
Get complete infrastructure visibility and rich log analytics without compromising performance or dropping data. The Elasticsearch columnar metrics engine outpaces others in ingest, storage, and query speed at any scale.


Learn how we rebuilt Elasticsearch as a leading columnar metrics datastore. See benchmarks.
SCHEMA AGNOSTIC
One datastore, all formats, no context switching
Most infrastructure monitoring stacks normalize everything into a single schema or force you to navigate multiple back ends and query languages. We don't. Whether you send us OpenTelemetry, Prometheus, Beats, or any other format, Elasticsearch stores each natively in a unified datastore and queries it as-is. No translation layer, no information loss, no swivel-chair investigations.
Bring your infrastructure into focus
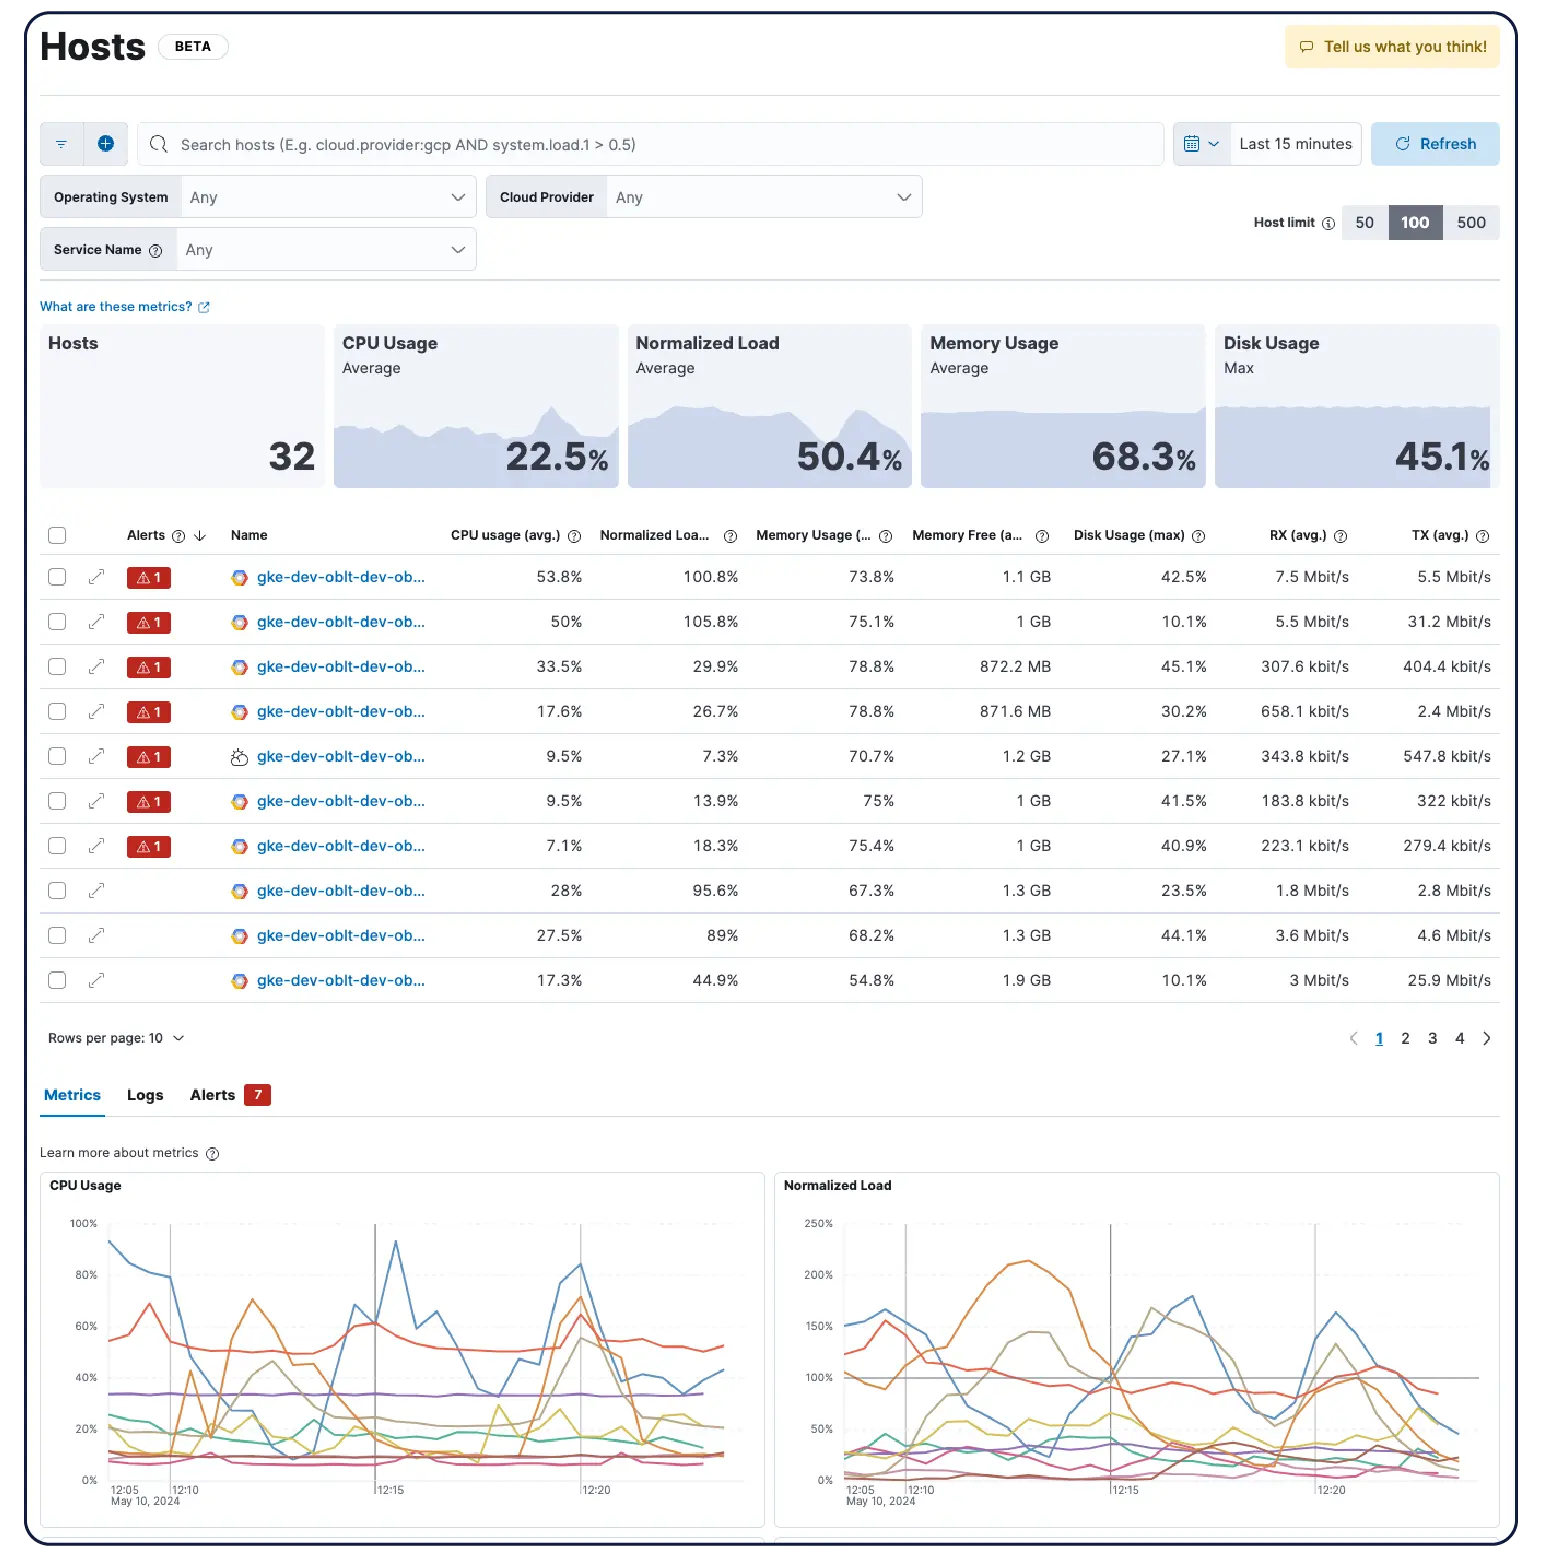
Whether you're running Kubernetes clusters, VMs, cloud, or on-prem servers, our 550+ prebuilt integrations, lightweight agents, and agentless collectors for AWS, Azure, and GCP make ingest painless.
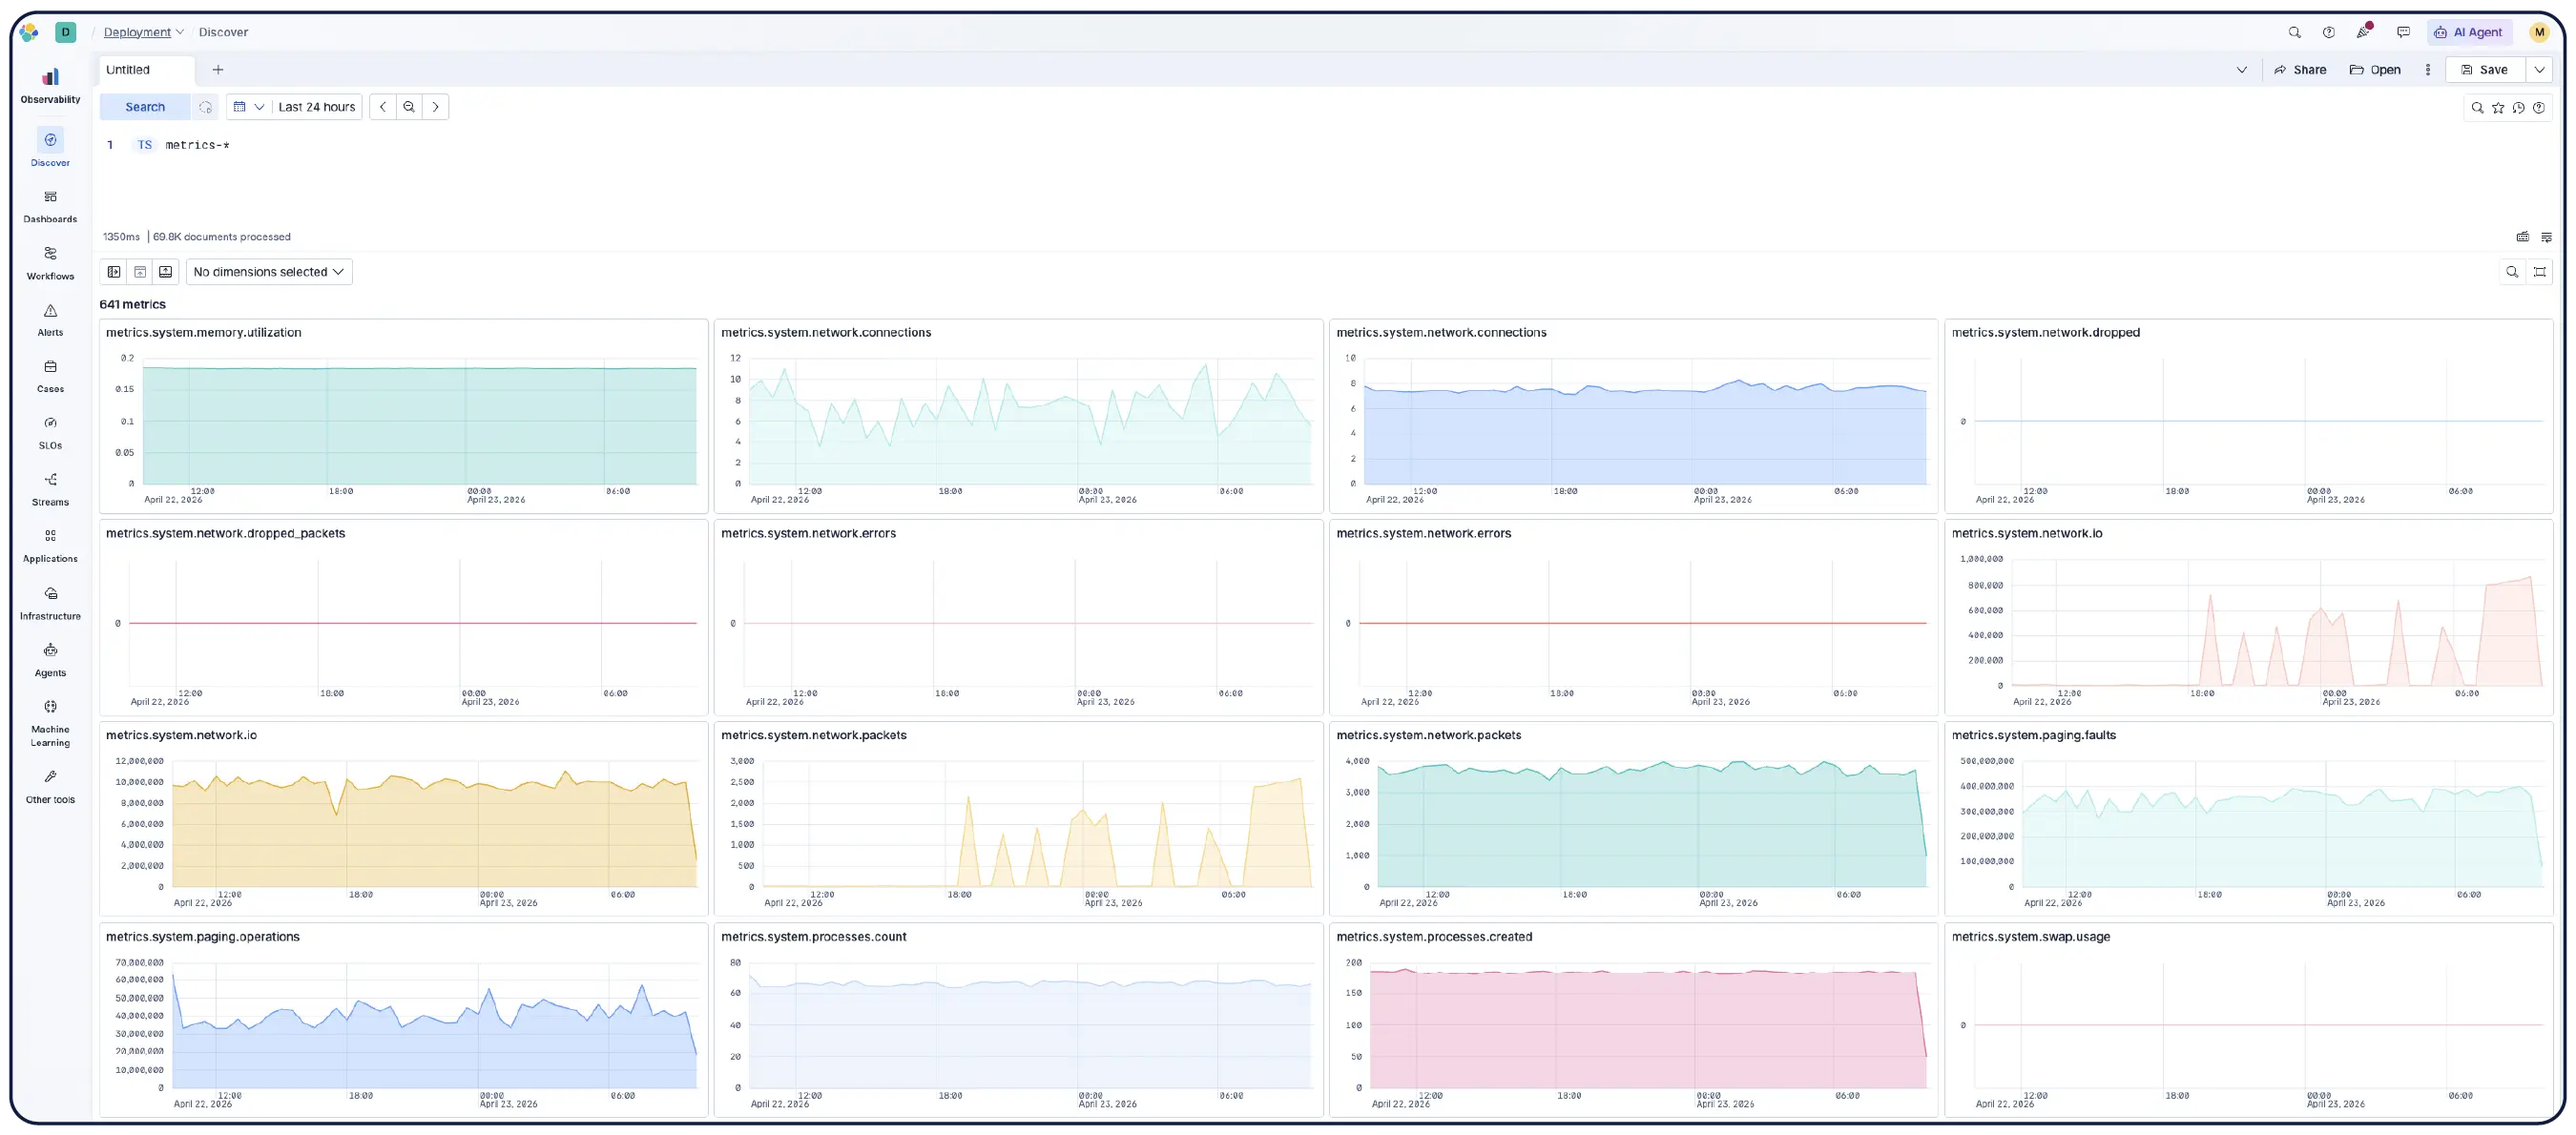
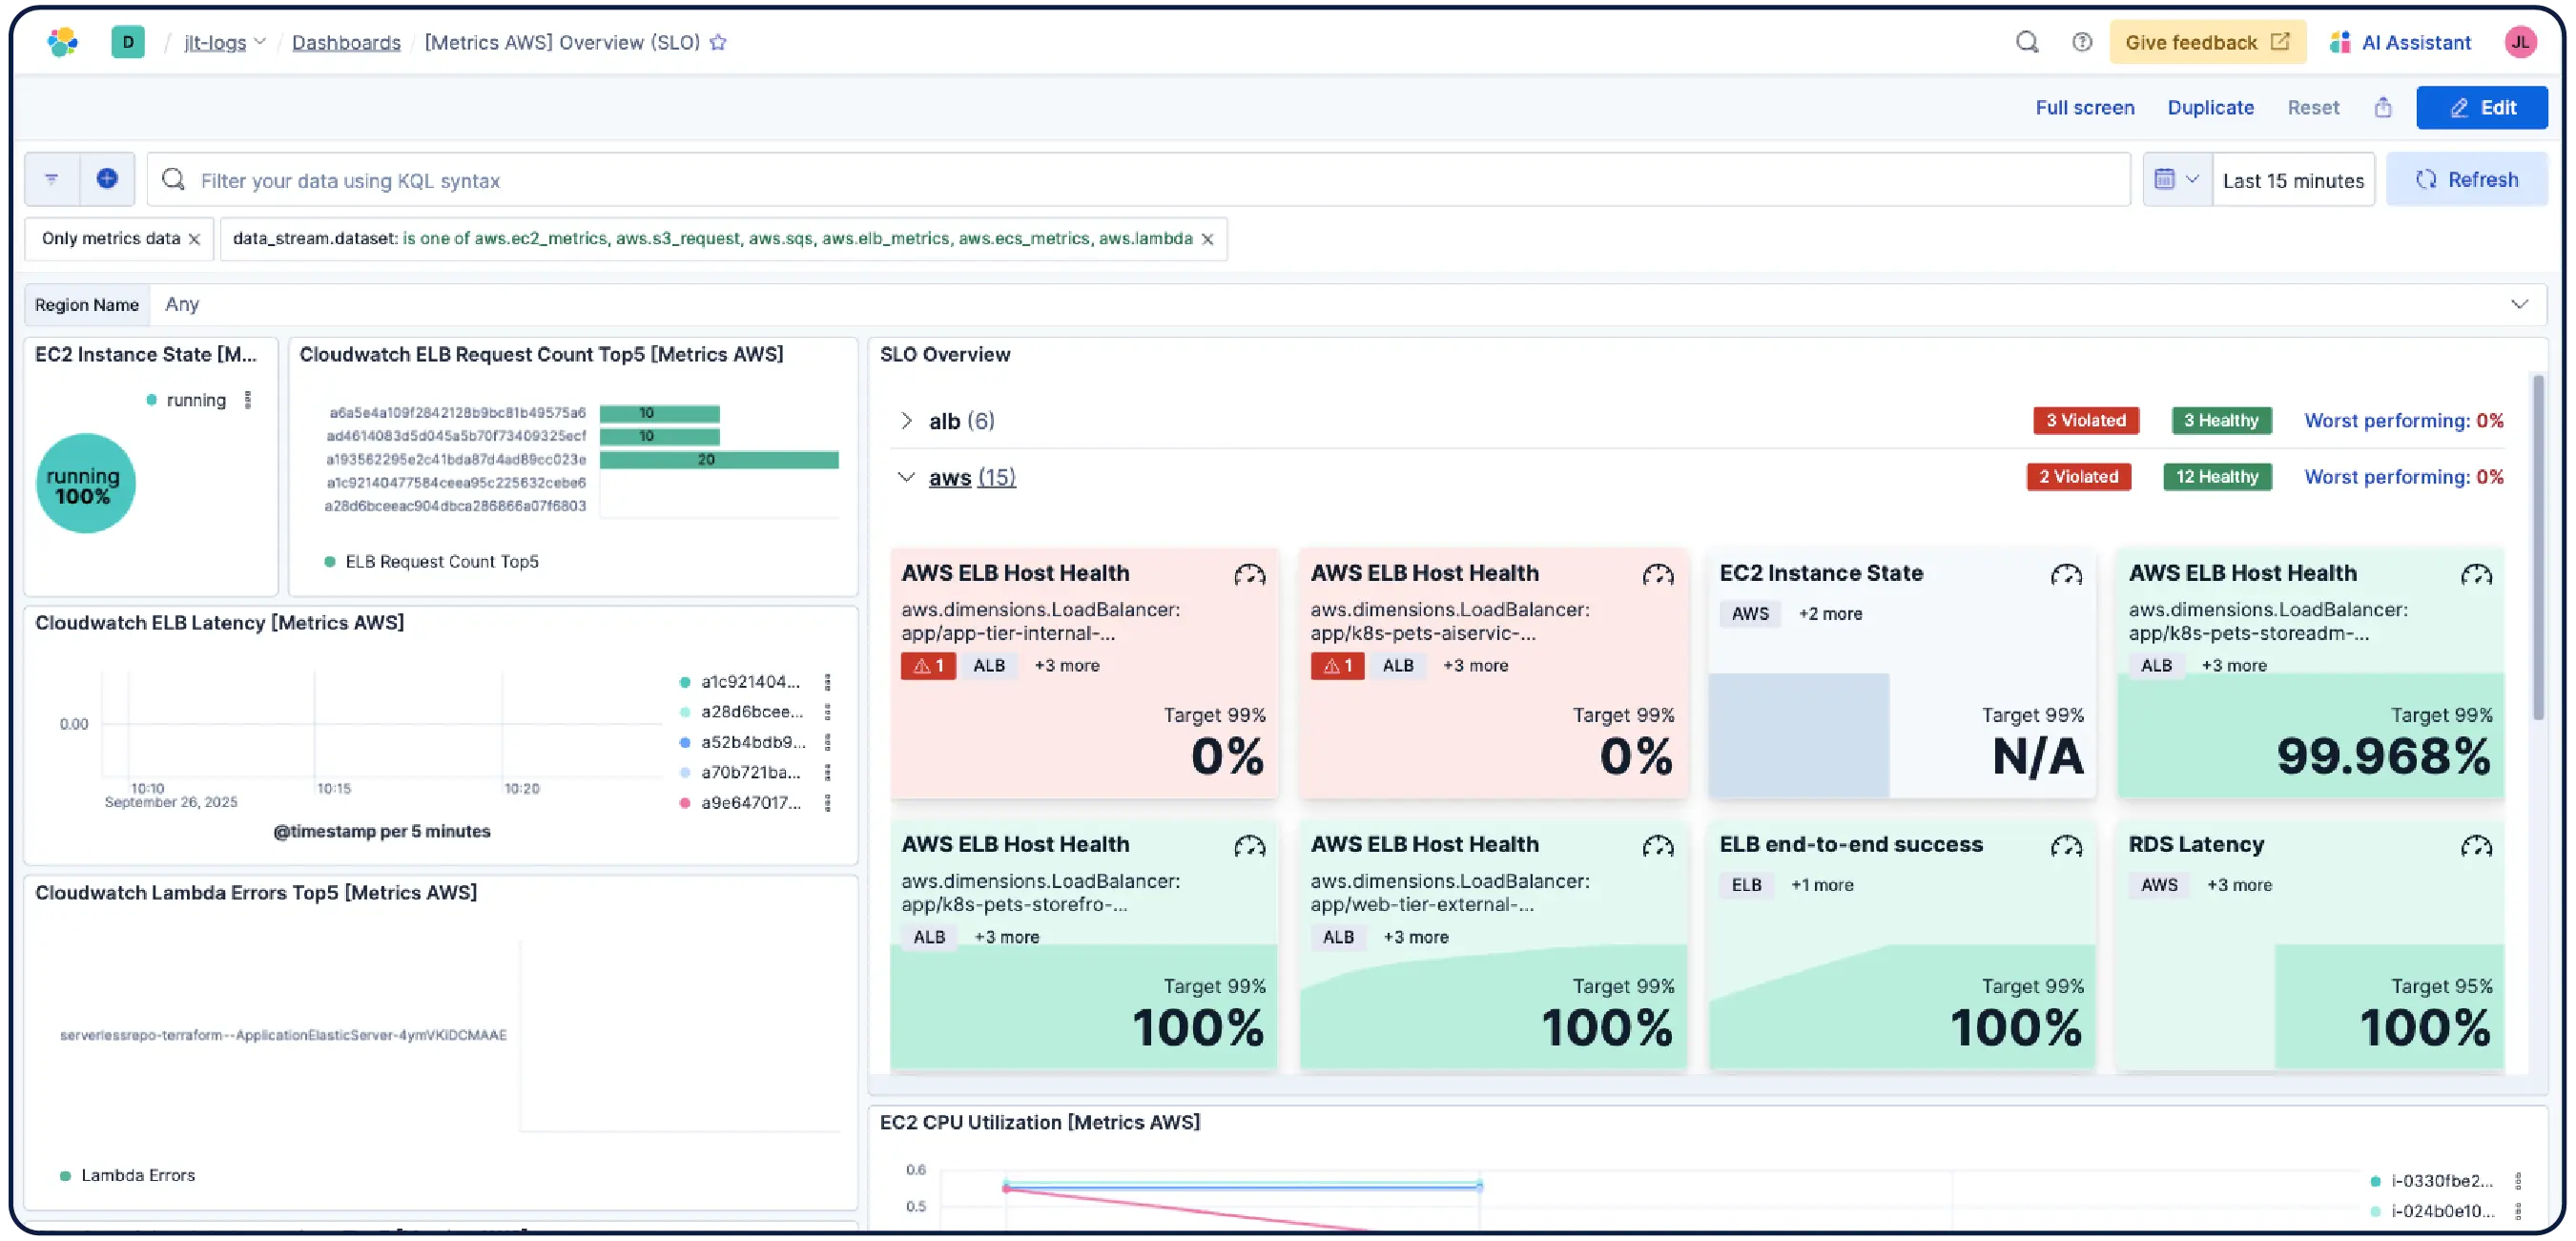
Search, filter, aggregate, and visualize data in Discover. Save sessions to dashboards, set alerts, and run ES|QL queries across any data for unified analysis. Filter by any metric on any dimension and run PromQL right in Kibana.
See why companies like yours choose Elastic Observability
Customer spotlight

Comcast ingests 400 terabytes of data daily with Elastic to monitor services and accelerate root cause analysis, ensuring a top-notch customer experience.
Customer spotlight

Zooplus uses Elastic to monitor 2,500 microservices, 20,000 containers, 600 AWS accounts with 70 AWS services, and 40 Kubernetes clusters.
Customer spotlight

Informatica cut costs and reduced MTTR by migrating its entire logging workload to Elastic for 100+ applications and 300+ Kubernetes clusters.
Join the chat
Connect to Elastic's global community and participate in open conversations and collaboration.


.jpg)

Frequently asked questions
Infrastructure monitoring tracks the health and performance of the systems your applications run on — web servers, containers, cloud instances, network devices, caches, queues, databases, storage, and more. It collects metrics like CPU usage, memory consumption, disk I/O, and pod restarts so teams can detect resource saturation, catch failures before they escalate, and understand how infrastructure conditions affect application behavior. Effective infrastructure monitoring correlates those metrics with logs and traces, so engineers can move from "this host is running hot" to root cause without switching tools.
Elastic Observability collects metrics, logs, and traces from hosts, containers, cloud services, and Kubernetes clusters and correlates them in Elasticsearch so teams can investigate across signals in one place. Elastic provides visibility across cloud, on-prem, Kubernetes, serverless, and hosts with 550+ out-of-the-box integrations and native OpenTelemetry support. Elastic Agent handles collection centrally via Fleet — no per-host agent configuration required. Machine learning-based anomaly detection surfaces unusual utilization patterns automatically, and because infrastructure metrics live alongside application traces and logs, engineers can pivot from an alert directly into correlated context without leaving the platform.
Yes. Elastic Observability is built for monitoring Kubernetes environments, including managed clusters on EKS, AKS, and GKE, and self-managed clusters. Elastic auto-discovers changes in dynamic Kubernetes workloads and monitors services and components wherever they run, with metadata enrichment on ingest so you can filter, track, and identify common attributes across your system. As pods spin up and down, Elastic keeps pace without manual reconfiguration. Cluster resource utilization, pod-level logs, application traces, and infrastructure metrics are all collected from a single deployment and correlated in Kibana, with anomaly detection and log categorization to surface issues you didn't know to look for.
Elastic Observability is built around open standards. It natively ingests OpenTelemetry Protocol (OTLP) — logs, metrics, and traces — without schema conversion or proprietary translation. EDOT, the Elastic Distributions of OpenTelemetry, gives you a production-ready OTel-native ecosystem: install the EDOT Collector, enable auto-instrumentation with language SDKs, and your data flows into Elasticsearch with the OTel schema untouched. Prometheus metrics and PromQL are supported natively, and 450+ one-click integrations cover cloud providers, databases, message queues, network devices, and application frameworks. Elastic Agent and Beats handle structured and unstructured log formats from virtually every common source.
Elastic addresses observability cost at both the storage and architecture layers. Logsdb index mode can reduce log storage needs by up to 65% by optimizing data ordering, eliminating duplication with synthetic _source, and improving compression. For metrics, Time Series Data Streams (TSDS) use columnar storage and time-series-specific codecs — delta-of-deltas, run-length encoding, XOR encoding — reducing metrics disk space by up to 70% across integrations like Kubernetes, AWS, and Nginx. For teams on Elastic Cloud Serverless, cloud-native object storage is the system of record, so all data is stored at object storage economics with no tiers or capacity planning required.
Elastic Observability uses consumption-based pricing with no per-host fees and no high-water mark billing. Datadog’s per-host pricing bills autoscaling events at peak node count for the entire month, not average usage. Custom metrics cost extra and can account for up to 52% of the average bill. Elastic's model means ephemeral workloads and high-cardinality Prometheus environments don't produce end-of-month surprises.