Articles

Agent Skills for Elastic Observability
Learn how Agent Skills for Elastic Observability help SREs and developers run observability workflows through natural language to instrument apps with OpenTelemetry, search logs, manage SLOs, understand service health, and help with LLM observability.

Agentic CI/CD: Kubernetes Deployment Gates with Elastic MCP Server
Deploy agentic CI/CD gates with Elastic MCP Server. Integrate AI agents into GitHub Actions to monitor K8s health and improve deployment reliability via Observability (O11y)

Troubleshooting your Agents and Amazon Bedrock AgentCore with Elastic Observability
Discover how to achieve end-to-end observability for Amazon Bedrock AgentCore: from tracking service health and token costs to debugging complex reasoning loops with distributed tracing.

Introducing Streams for Observability: Your first stop for investigations
Introducing Elastic Streams, an new AI observability feature that transforms logs from a noisy and expensive data source into a primary investigation signal.

Elastic’s Managed OTLP Endpoint: Simpler, Scalable OpenTelemetry for SREs
Streamline OpenTelemetry data ingestion with Elastic Observability's new managed OTLP endpoint available on Elastic Cloud Serverless. Get native OTel storage and Elastic-grade scaling for logs, metrics, and traces, simplifying observability for SREs.

Serverless log analytics powered by Elasticsearch, in a new low priced tier
Elastic Observability Logs Essentials delivers cost-effective, hassle-free log analytics on Elastic Cloud Serverless. SREs can ingest, search, enrich, analyze, store, and act on logs without the operational overhead of managing the deployment.

LLM Observability with Elastic’s Azure AI Foundry Integration
Gain comprehensive visibility into your generative AI workloads on Azure AI Foundry. Monitor token usage, latency, and cost, while leveraging built-in content filters to ensure safe and compliant application behavior—all with out-of-the-box observability powered by Elastic.

Optimizing Spend and Content Moderation on Azure OpenAI with Elastic
We have added further capabilities to the Azure OpenAI GA package, which now offer content filter monitoring and enhancements to the billing insights!

Elastic Distributions of OpenTelemetry (EDOT) Now GA: Open-Source, Production-Ready OTel
Elastic is proud to introduce General Availability of Elastic Distributions of OpenTelemetry (EDOT), which contains Elastic’s versions of the OpenTelemetry Collector and several language SDKs like Python, Java, .NET, and NodeJS. These help provide enhanced features and enterprise-grade support for EDOT.

End to end LLM observability with Elastic: seeing into the opaque world of generative AI applications
Elastic’s LLM Observability delivers end-to-end visibility into the performance, reliability, cost, and compliance of LLMs across Amazon Bedrock, Azure OpenAI, Google Vertex AI, and OpenAI, empowering SREs to optimize and troubleshoot AI-powered applications.

Tracing a RAG based Chatbot with Elastic Distributions of OpenTelemetry and Langtrace
How to observe a OpenAI RAG based application using Elastic. Instrument the app, collect logs, traces, metrics, and understand how well the LLM is performing with Elastic Distributions of OpenTelemetry on Kubernetes with Langtrace.

Tracing, logs, and metrics for a RAG based Chatbot with Elastic Distributions of OpenTelemetry
How to observe a OpenAI RAG based application using Elastic. Instrument the app, collect logs, traces, metrics, and understand how well the LLM is performing with Elastic Distributions of OpenTelemetry on Kubernetes and Docker.

Native OTel-based K8s & App Observability in 3 Steps with Elastic
Elastic's Distributions of OpenTelemetry are now supported with the OTel Operator, providing auto instrumentation of applications with EDOT SDKs, and deployment and lifecycle management of the EDOT OTel Collector for Kubernetes Observability. Learn how to configure this in 3 easy steps

Unlock possibilities with native OpenTelemetry: prioritize reliability, not proprietary limitations
Elastic now supports Elastic Distributions of OpenTelemetry (EDOT) deployment and management on Kubernetes, using OTel Operator. SREs can now access out-of the-box configurations and dashboards designed to streamline collector deployment, application auto-instrumentation and lifecycle management with Elastic Observability.

Best Practices for Log Management: Leveraging Logs for Faster Problem Resolution
Explore effective log management strategies to improve system reliability and performance. Learn about data collection, processing, analysis, and cost-effective management of logs in complex software environments.

Accelerate log analytics in Elastic Observability with Automatic Import powered by Search AI
Migrate your logs to AI-driven log analytics in record time by automating custom data integrations

Observing Langchain applications with Elastic, OpenTelemetry, and Langtrace
Langchain applications are growing in use. The ability to build out RAG-based applications, simple AI Assistants, and more is becoming the norm. Observing these applications is even harder. Given the various options that are out there, this blog shows how to use OpenTelemetry instrumentation with Langtrace and ingest it into Elastic Observability APM

LLM Observability with Elastic, OpenLIT and OpenTelemetry
Langchain applications are growing in use. The ability to build out RAG-based applications, simple AI Assistants, and more is becoming the norm. Observing these applications is even harder. Given the various options that are out there, this blog shows how to use OpenTelemetry instrumentation with the OpenLIT instrumentation library to ingest traces into Elastic Observability APM.

Introducing Elastic Distributions of OpenTelemetry
Elastic is proud to introduce Elastic Distributions of OpenTelemetry (EDOT), which contains Elastic’s versions of the OpenTelemetry Collector and several language SDKs like Python, Java, .NET, and NodeJS. These help provide enhanced features and enterprise-grade support for EDOT.

Tracing LangChain apps with Elastic, OpenLLMetry, and OpenTelemetry
LangChain applications are growing in use. The ability to build out RAG-based applications, simple AI Assistants, and more is becoming the norm. Observing these applications is even harder. Given the various options that are out there, this blog shows how to use OpenTelemetry instrumentation with OpenLLMetry and ingest it into Elastic Observability APM

NGNIX log analytics with GenAI in Elastic
Elastic has a set of embedded capabilities such as a GenAI RAG-based AI Assistant and a machine learning platform as part of the product baseline. These make analyzing the vast number of logs you get from NGINX easier.

AWS VPC Flow log analysis with GenAI in Elastic
Elastic has a set of embedded capabilities such as a GenAI RAG-based AI Assistant and a machine learning platform as part of the product baseline. These make analyzing the vast number of logs you get from AWS VPC Flows easier.

Elastic's RAG-based AI Assistant: Analyze application issues with LLMs and private GitHub issues
In this blog, we review how GitHub issues and other GitHub documents from internal and external GitHub repositories can be used in root cause analysis with Elastic’s RAG-based AI Assistant.

Analyzing OpenTelemetry apps with Elastic AI Assistant and APM
Elastic Observability provides native OpenTelemetry support, but analyzing applications logs, metrics, and traces can be daunting. Elastic Observability not only provides AIOps features but also an AI Assistant (co-pilot) to help get to MTTR faster.

Build better Service Level Objectives (SLOs) from logs and metrics
To help manage operations and business metrics, Elastic Observability's SLO (Service Level Objectives) feature was introduced in 8.12. This blog reviews this feature and how you can use it with Elastic's AI Assistant to meet SLOs.

Optimizing Observability with ES|QL: Streamlining SRE operations and issue resolution for Kubernetes and OTel
ES|QL enhances operational efficiency, data analysis, and issue resolution for SREs. This blog covers the advantages of ES|QL in Elastic Observability and how it can apply to managing issues instrumented with OpenTelemetry and running on Kubernetes.

Best practices for instrumenting OpenTelemetry
Instrumenting OpenTelemetry is complex. Even using auto-instrumentation requires understanding details about your application and OpenTelemetry configuration options. We’ll cover the best practices for instrumenting applications for OpenTelemetry.

Native OpenTelemetry support in Elastic Observability
Elastic offers native support for OpenTelemetry by allowing for direct ingest of OpenTelemetry traces, metrics, and logs without conversion, and applying any Elastic feature against OTel data without degradation in capabilities.
.jpg&w=828&q=75)
Automatic instrumentation with OpenTelemetry for Python applications
Learn how to auto-instrument Python applications using OpenTelemetry. With standard commands in a Docker file, applications can be instrumented quickly without writing code in multiple places, enabling rapid change, scale, and easier management.
.jpg&w=828&q=75)
Manual instrumentation with OpenTelemetry for Node.js applications
In this blog post, we will show you how to manually instrument Node.js applications using OpenTelemetry. We will explore how to use the proper OpenTelemetry Node.js libraries and in particular work on instrumenting tracing in a Node.js application.
.jpg&w=828&q=75)
Manual instrumentation with OpenTelemetry for Python applications
In this blog post, we will show you how to manually instrument Python applications using OpenTelemetry. We will explore how to use the proper OpenTelemetry Python libraries and in particular work on instrumenting tracing in a Python application.
.jpg&w=828&q=75)
Automatic instrumentation with OpenTelemetry for Node.js applications
Learn how to auto-instrument Node.js applications using OpenTelemetry. With standard commands in a Docker file, applications can be instrumented quickly without writing code in multiple places, enabling rapid change, scale, and easier management.

Managing your applications on Amazon ECS EC2-based clusters with Elastic Observability
Learn how to manage applications on Amazon ECS clusters based on EC2 instances and how simple it is to use Elastic agents with the AWS and docker integrations to provide a complete picture of your apps, ECS service, and corresponding EC2 instances.

Unleash the power of Elastic and Amazon Kinesis Data Firehose to enhance observability and data analytics
AWS users can now leverage the new Amazon Kinesis Firehose Delivery Stream to directly ingest logs into Elastic Cloud in real time for centralized alerting, troubleshooting, and analytics across your cloud and on-premises infrastructure.

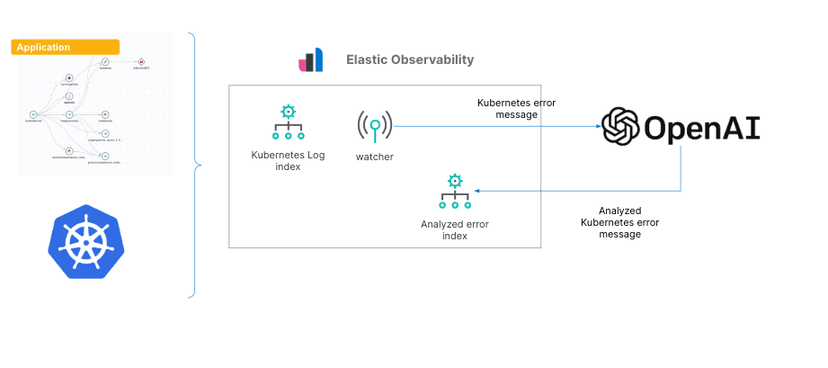
Gain insights into Kubernetes errors with Elastic Observability logs and OpenAI
This blog post provides an example of how one can analyze error messages in Elasticsearch with ChatGPT using the OpenAI API via Elasticsearch.

Trace your Azure Function application with Elastic Observability
Serverless applications deployed on Azure Functions are growing in usage. This blog shows how to deploy a serverless application on Azure functions with Elastic Agent and use Elastic's APM capability to manage and troubleshoot issues.

Root cause analysis with logs: Elastic Observability's AIOps Labs
Elastic Observability provides more than just log aggregation, metrics analysis, APM, and distributed tracing. Our machine learning-based AIOps capabilities help you analyze the root cause of issues allowing you to focus on the most important tasks.

Root cause analysis with logs: Elastic Observability's anomaly detection and log categorization
Elastic Observability provides more than just log aggregation, metrics analysis, APM, and distributed tracing. Elastic’s machine learning capabilities help analyze the root cause of issues, allowing you to focus your time on the most important tasks.

Easily analyze AWS VPC Flow Logs with Elastic Observability
Elastic Observability can ingest and help analyze AWS VPC Flow Logs from your application’s VPC. Learn how to ingest AWS VPC Flow Logs through a step-by-step method into Elastic, then analyze it and apply OOTB machine learning for insights.

Wait… Elastic Observability monitors metrics for AWS services in just minutes?
Get metrics and logs from your AWS deployment and Elastic Observability in just minutes! We’ll show you how to use Elastic integrations to quickly monitor and manage the performance of your applications and AWS services to streamline troubleshooting.
.jpg&w=828&q=75)
Independence with OpenTelemetry on Elastic
OpenTelemetry has become a key component for observability given its open standards and developer-friendly tools. See how easily Elastic Observability integrates with OTel to provide a platform that minimizes vendor lock-in and maximizes flexibility.

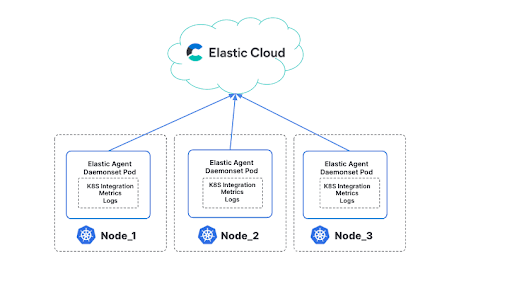
Managing your Kubernetes cluster with Elastic Observability
Unify all of your Kubernetes metrics, log, and trace data on a single platform and dashboard, Elastic. From the infrastructure to the application layer Elastic Observability makes it easier for you to understand how your cluster is performing.
