Elastic named a Leader in the 2025 Gartner® Magic Quadrant™ for Observability Platforms

 Share on Twitter
Share on Twitter

 Share on LinkedIn
Share on LinkedIn

 Share on Facebook
Share on Facebook

 Share by Email
Share by email

 Print this page
Print
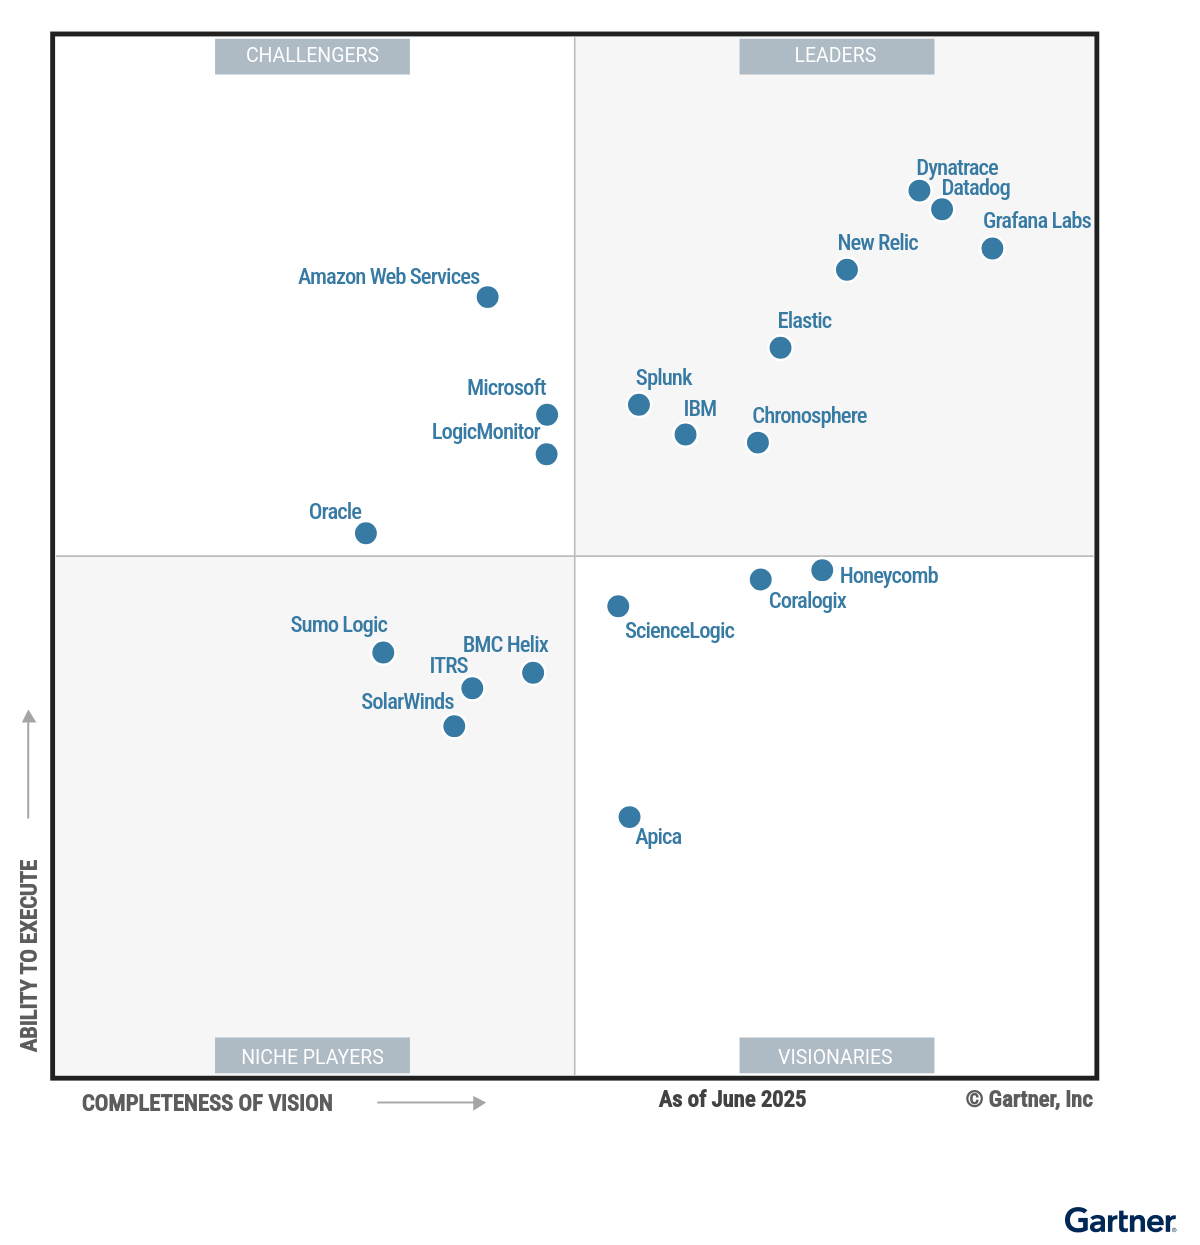
Observability has an investigation problem, and dashboards and alerts aren’t enough for solving problems in today’s complex systems. AI-driven capabilities, powerful analytics, and the ability to scale are essential to drive real-time investigations while keeping costs low. We think this is why Elastic has been named a Leader in the 2025 Gartner® Magic Quadrant™ for Observability Platforms for the second time.
Customers are no longer just looking for visibility. They need answers quickly and with context. Elastic’s recognition in this year’s Gartner Magic Quadrant reflects how our AI-driven capabilities are transforming observability from a reactive tool into a solution for real-time investigations. We’re proud to help the world’s most innovative teams stay ahead of issues, optimize performance, and operate with confidence.
Santosh Krishnan, General Manager, Elastic Observability
Elastic Observability helps organizations monitor, troubleshoot, and optimize their entire ecosystem from infrastructure and application performance to end-user experience, all powered by the Search AI Platform. We think our inclusion as a Leader reinforces our belief that open architecture, AI-powered insights, and scalability are the future of observability.
Why we think Elastic is a Leader again
We think Elastic’s placement as a Leader in the Magic Quadrant reflects its continued investment in open standards, AI-driven innovation, breadth of capabilities, and deployment flexibility. Elastic provides:
OpenTelemetry-native support: Elastic integrates natively with OpenTelemetry, allowing organizations to standardize on open source instrumentation without custom connectors.
AI-driven assistance: Elastic’s built-in AI Assistant leverages retrieval-augmented generation (RAG) and context-aware relevance to help teams triage incidents and troubleshoot using natural language and institutional knowledge, accelerating root cause analysis across logs, metrics, and traces.
Zero-config AIOps: Elastic’s out-of-the-box machine learning capabilities automatically detect anomalies, forecast trends, and uncover patterns across logs, metrics, and traces.
Advanced analytics: Elastic’s new query language (ES|QL) enables intuitive, step-by-step complex investigations by allowing advanced and faster queries across observability data.
Optimized cost, scale, and performance: Elastic's Search AI Lake supports petabytes of structured and unstructured data, enabling cost-efficient, high performance data storage without retention compromises.
Elastic’s ability to deliver enterprise-grade observability through an open architecture that is flexible and AI-powered continues to differentiate it from alternatives in the market.
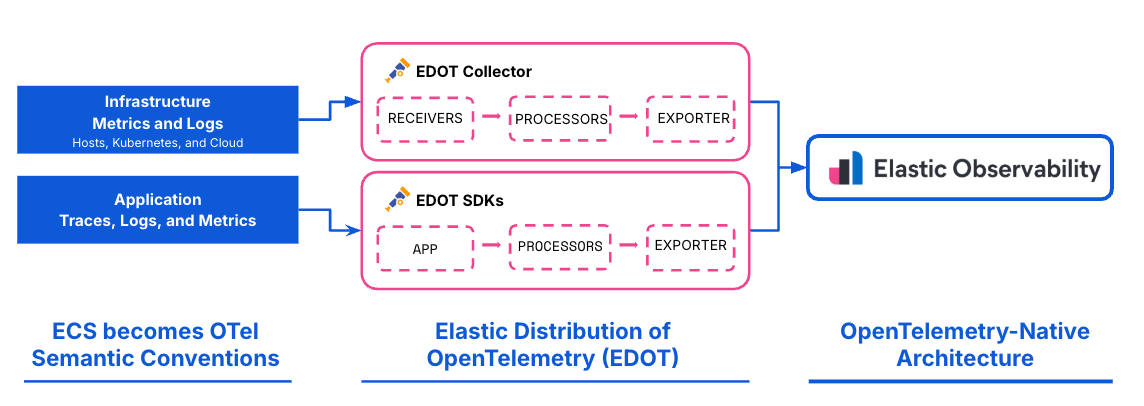
Open by design, with Native OpenTelemetry (OTel) support
Our belief in openness is a core design principle that shapes how we build and support our products. In observability, that means embracing open standards and making it easier for teams to work across complex, multi-vendor environments, without the need for bespoke integrations and instrumentation.
Elastic is 100% OTel-native, from ingest to analysis. It retains OTel data natively without requiring data translation, eliminating the need for SREs to handle tedious schema conversions and develop customized views. All Elastic Observability capabilities, such as logs analytics, APM, infrastructure monitoring, and AI-driven issue analysis, seamlessly work with native OTel data.
Over the past two years, Elastic has made major contributions to OpenTelemetry, including our donations of ECS (Elastic Common Schema) and Elastic’s Profiling Agent. We’re continuously contributing to OTel, making Elastic one of the top three contributors.
As enterprises adopt OTel community SDKs, they run into a supportability challenge, which includes unreliable support, slow bug fixes, and untested updates, causing operational risks and downtime. Elastic has released its Elastic Distributions of OpenTelemetry (EDOT) to solve the supportability challenge with enterprise grade support, rapid bug fixes, and quick updates for OTel SDKs.
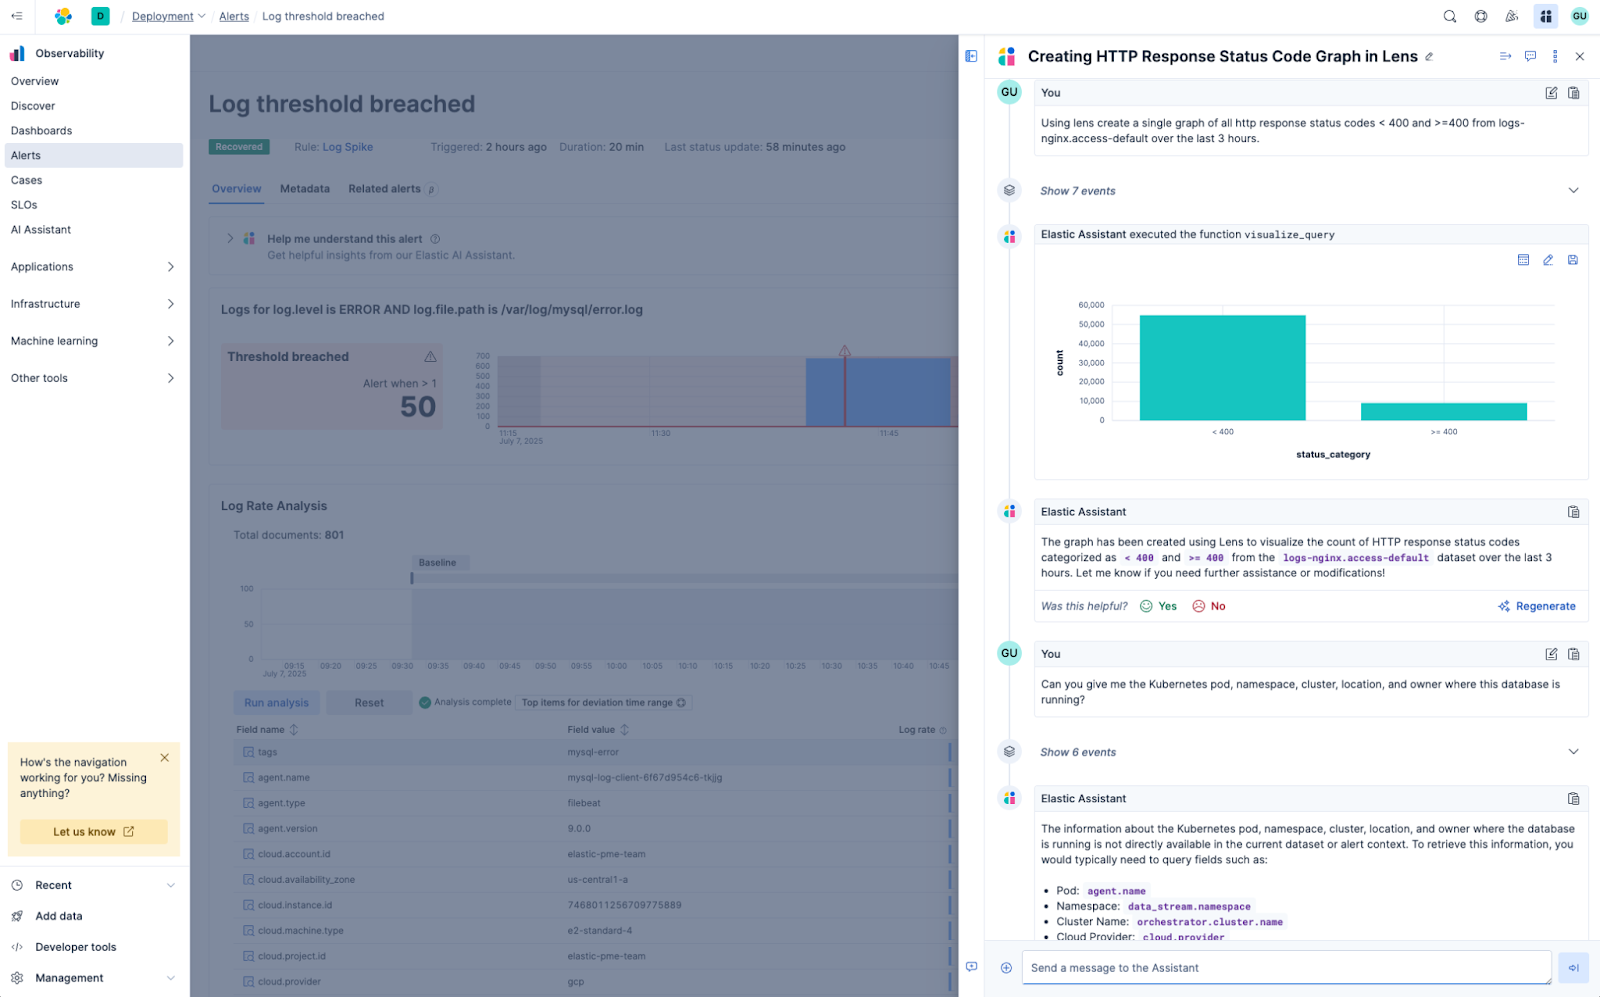
AI-based investigations for complex problems
As an SRE, troubleshooting issues is more complex than ever. Regardless of the situation, there is a ton of information that needs to be consumed and processed. This includes not only what the customer is experiencing, but also internal data and context to help provide the most appropriate resolution.
Elastic offers AI-driven capabilities such as multi-signal anomaly detection, pattern analysis, and correlation and an AI Assistant that acts as a virtual SRE.
With Elastic’s AI Assistant, an SRE can perform analysis using natural language questions. Elastic’s AI Assistant versatility comes not only from connecting to an out of box LLM or one of your choice, but also leveraging Elastic’s vector database to provide contextual and insightful information such as:
Issues from internal GitHub repos, Jira, etc.
Customer issues from your support service
Retrieving and using runbooks
Creating charts and dashboards
LLM observability with AI tokens, hallucinations, and latency under one roof
Managing LLMs is vital for Service Reliability Engineers (SREs) to manage GenAI applications and ensure error-free operations while minimizing the risks associated with the unpredictable nature of LLM generated responses.
Elastic provides out-of-the-box integrations for all major models, such as Azure OpenAI, OpenAI, Amazon Bedrock, and Google Vertex AI. These integrations include prebuilt dashboards that display token usage, cost-related metrics, and logs and metrics such as total invocations, error rates, and latency, broken down by model or endpoint. Cost insights are delivered automatically through Elastic’s alerting, SLOs, AI Assistant, and any configured ML jobs.
Lowering costs without complexity or performance impacts
Managing the bill to keep your observability data costs down creates headaches. Observability platforms need to be able to store the data cost effectively at high resolution and still access it fast.
With Elasticsearch logsdb index mode, Elastic has reduced the storage footprint of log data in Elasticsearch by up to 65%. This allows users to store more observability and security data without exceeding their budget, while keeping all data accessible and searchable.
Read the full report
The 2025 Gartner® Magic Quadrant™ for Observability Platforms is now available. Access the report.
Explore how Elastic Observability delivers unified visibility, AI-driven insights, and unmatched scale — all on your terms.
Gartner, Magic Quadrant for Observability Platforms,
Gregg Siegfried, Matt Crossley, Padraig Byrne, Andre Bridges, Martin Caren 7 July 2025.
GARTNER is a registered trademark and service mark of Gartner, Inc. and/or its affiliates in the U.S. and internationally, and MAGIC QUADRANT is a registered trademark of Gartner, Inc. and/or its affiliates and are used herein with permission. All rights reserved.
Gartner does not endorse any vendor, product or service depicted in its research publications, and does not advise technology users to select only those vendors with the highest ratings or other designation. Gartner research publications consist of the opinions of Gartner’s research organization and should not be construed as statements of fact. Gartner disclaims all warranties, expressed or implied, with respect to this research, including any warranties of merchantability or fitness for a particular purpose.
The release and timing of any features or functionality described in this post remain at Elastic's sole discretion. Any features or functionality not currently available may not be delivered on time or at all.
This graphic was published by Gartner, Inc. as part of a larger research document and should be evaluated in the context of the entire document. The Gartner document is available upon request from Elastic.
Share
- Share on Twitter
Share on Twitter
- Share on LinkedIn
Share on LinkedIn
- Share on Facebook
Share on Facebook
- Share by Email
Share by email
- Print this page
Print

