Monitor Elasticsearch Service costs with billing integration and alerts
Track, customize, and alert on Elasticsearch Service expenses using Elasticsearch service billing integration.


 Share on Twitter
Share on Twitter

 Share on LinkedIn
Share on LinkedIn

 Share on Facebook
Share on Facebook

 Share by Email
Share by email

 Print this page
Print
Monitoring and managing your Elasticsearch Service (ESS) usage and costs is crucial for efficient operations. The Elasticsearch Service Billing integration offers a streamlined approach to collect, visualize, and act upon your billing data. In this article, I'll guide you through deploying this integration, customizing it to align with your organizational structure, and setting up alerts to monitor team-specific expenditures.
Deploying the Elasticsearch Service Billing integration
To begin, identify an Elasticsearch cluster with an attached Fleet-enabled Elastic Agent where the integration can be deployed. This agent will need internet access, as it will poll Elastic billing APIs and parse the resulting data, allowing you to leverage the preconfigured dashboards. Your monitoring cluster on Elastic Cloud Hosted could be a prime candidate for this.
Pre-flight checks
Before installing the integration and adding it to an agent policy, you will need to retrieve some information for your organization:
- The organization ID: Navigate to your Elastic Cloud organization page to find your organization identifier.
- A billing API key: On the API keys page, create an API key with the Billing admin role.
Deploying the integration
On the Integrations page in Kibana, search for the "Elasticsearch Service Billing" integration and click on Add Elasticsearch Service Billing.
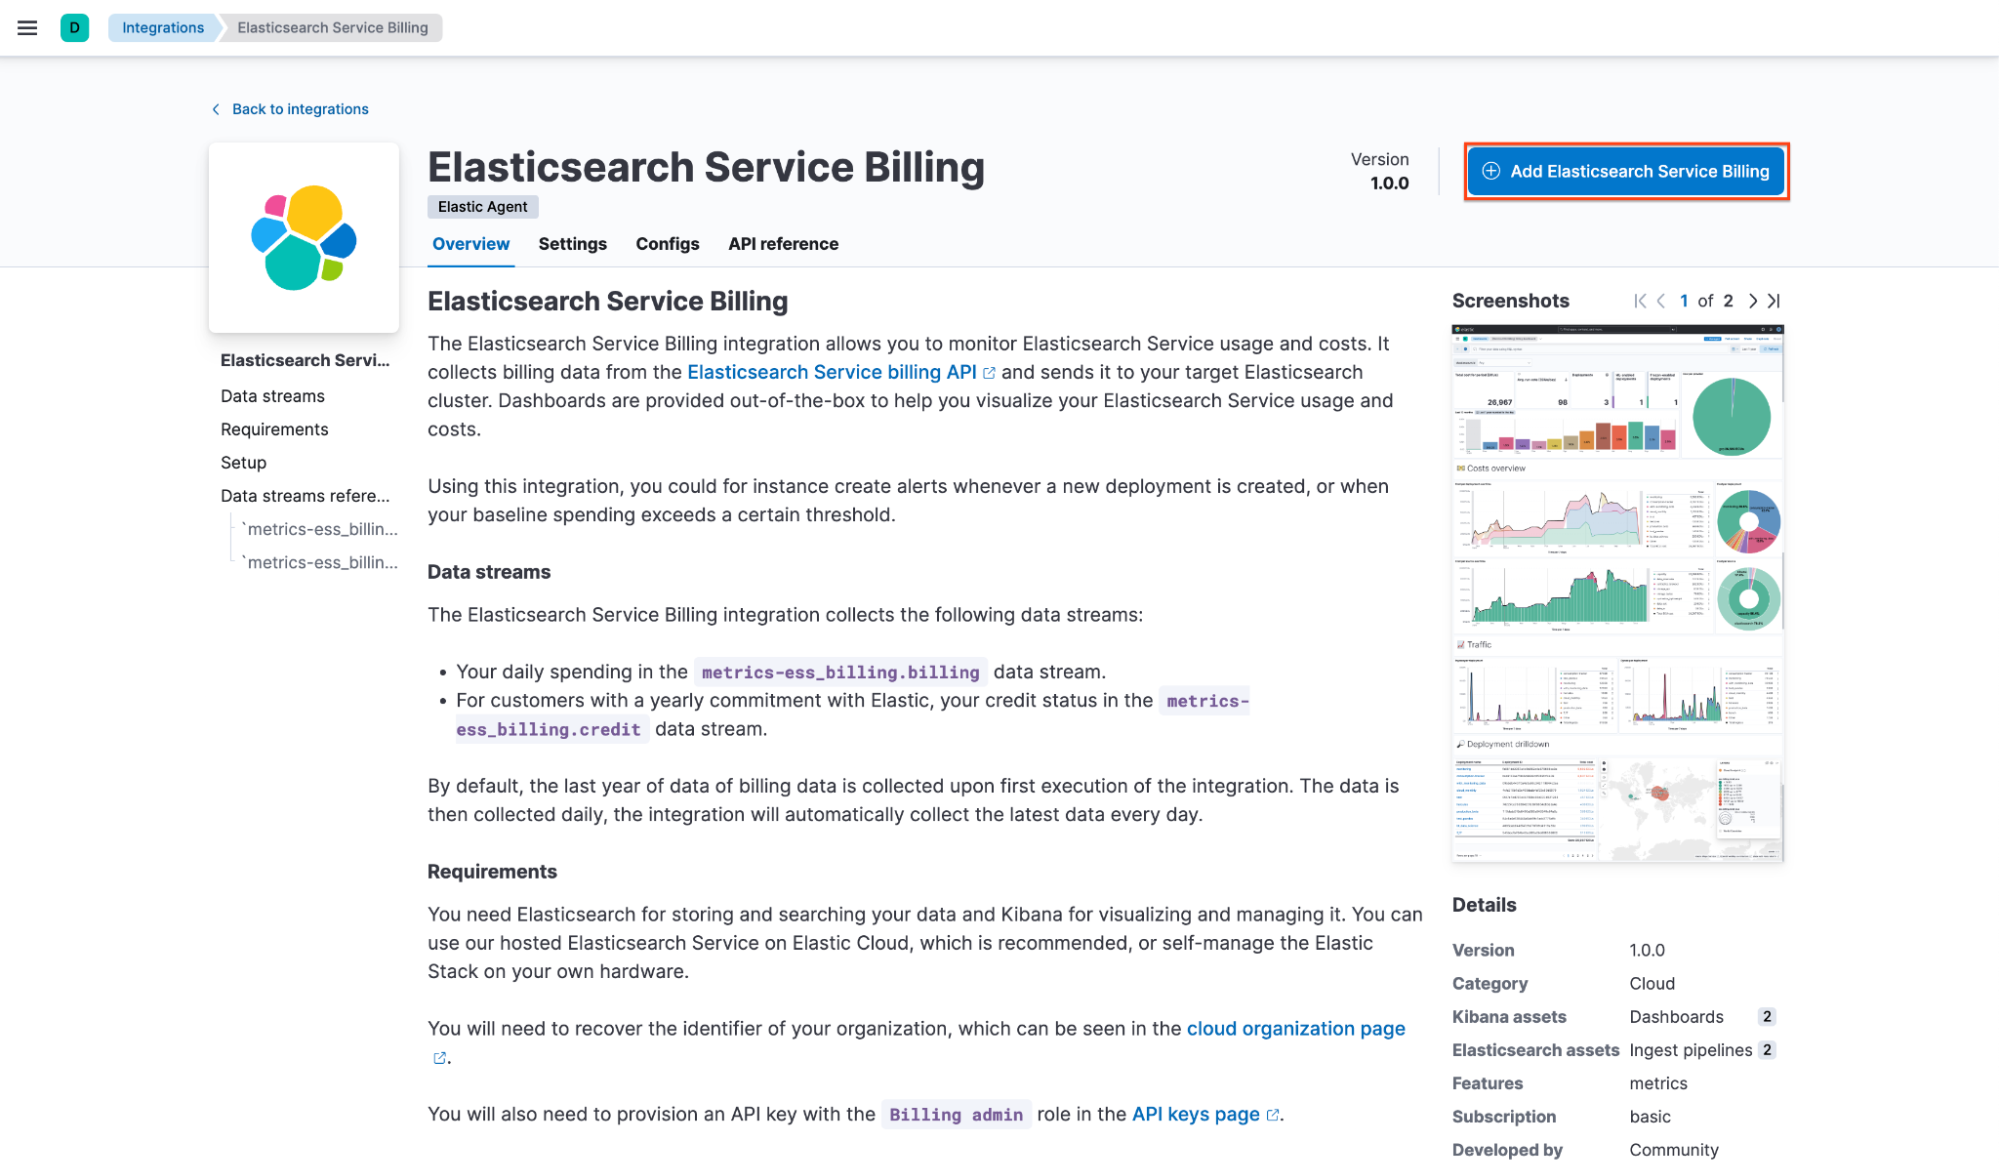
Fill in the requested information, which you collected in the previous step. You can also customize how far back the billing data should be collected during the first run (one year by default) and how often the collection should occur. Please note, however, that the billing data is collected with a daily granularity, so changing the default frequency of 24 hours will bring little benefit.
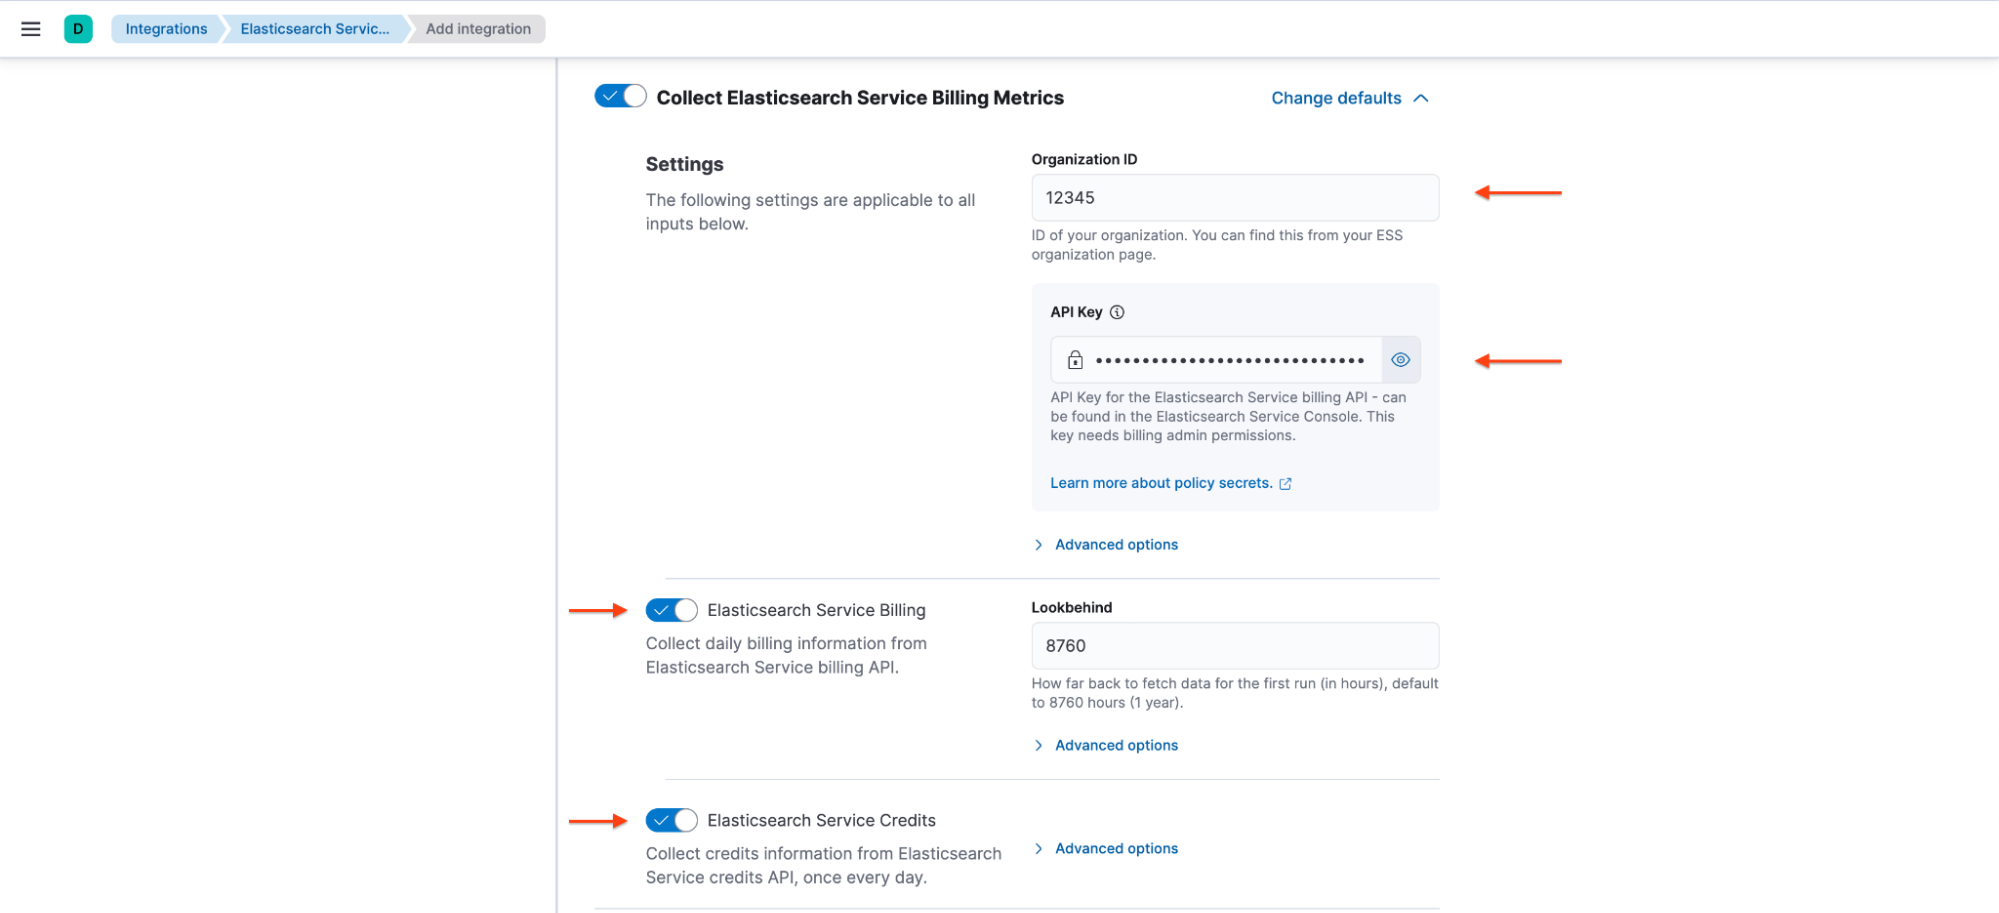
Also note that the second dataset (Elasticsearch Service Credits) requires an active commercial commitment with Elastic to collect data properly.
Finally, deploy the integration to the agent policy of your choice. With version 1.2.0 of the integration, and underlying stack version 8.17.0+, it is also possible to deploy this integration agentless.

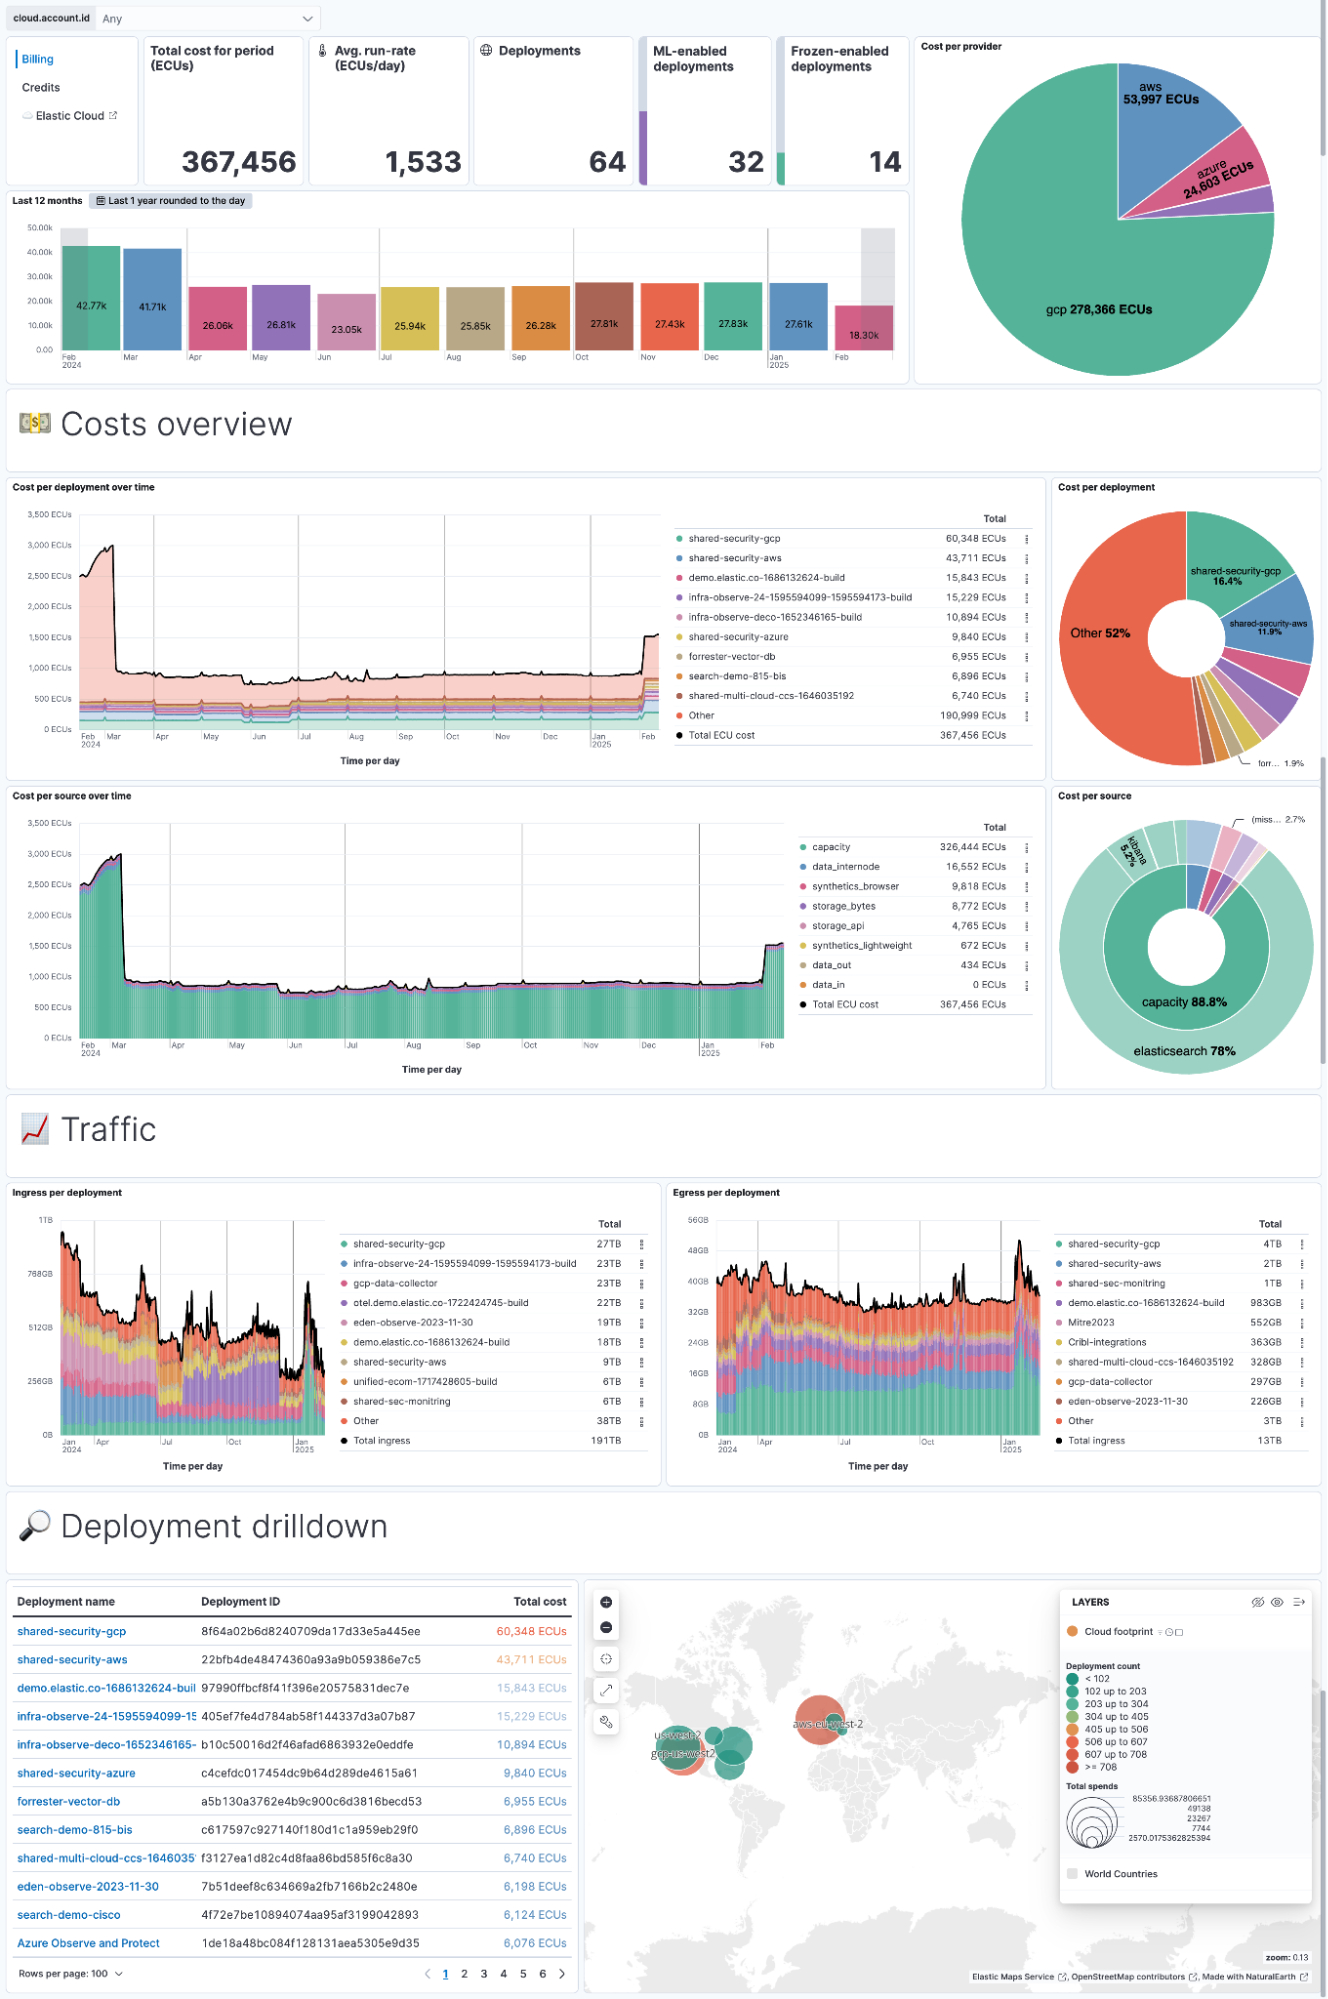
Visualizing ECU use
Once deployed, the integration will start polling Elastic billing APIs until your configured lookbehind period is fully onboarded. This can take a few minutes — be patient after the initial install, or change the time picker to whatever lookbehind value you used during install to see the progress in real time.
Drilling down: Defining deployment ownership
Now that you are collecting billing information for the entire organization, you will want to attribute the costs related to specific deployments to the teams that own them.
For this purpose, create an @custom pipeline for the integration, where you can define your logic.
For my example, I will use the following logic:
All deployments with “test” in their name will be attributed to the QA team.
All deployments with “security” in their name will be attributed to the Security team.
All other deployments will be attributed to the Development team.
Creating the custom template and ingest pipeline
Implementing this logic requires declaring new fields in the custom template and then creating the ingest pipeline:
PUT /_component_template/metrics-ess_billing.billing@custom
{
"template": {
"mappings": {
"properties": {
"team": {
"type": "keyword"
}
}
}
}
}
PUT /_ingest/pipeline/metrics-ess_billing.billing@custom
{
"processors": [
{
"set": {
"field": "team",
"value": "development"
}
},
{
"set": {
"field": "team",
"value": "security",
"if": "ctx.ess.billing.deployment_name ==~ /.*security.*/"
}
},
{
"set": {
"field": "team",
"value": "QA",
"if": "ctx.ess.billing.deployment_name ==~ /.*test.*/"
}
}
]
}
You could also use the enrich processor to create a “join” with a reference base, thereby linking each deployment to its owner.
Altering historical data
It is likely that you added the above ingest pipeline after the initial data pull, in which case a lot of the data is currently missing the newly defined field. You can “fix” your data by manually updating the mapping for the indices that already exist and performing an update by query:
PUT metrics-ess_billing.billing-*/_mapping
{
"properties": {
"team": {
"type": "keyword"
}
}
}
POST /metrics-ess_billing.billing-*/_update_by_query?pipeline=metrics-ess_billing.billing@custom&wait_for_completion=falseViewing the results
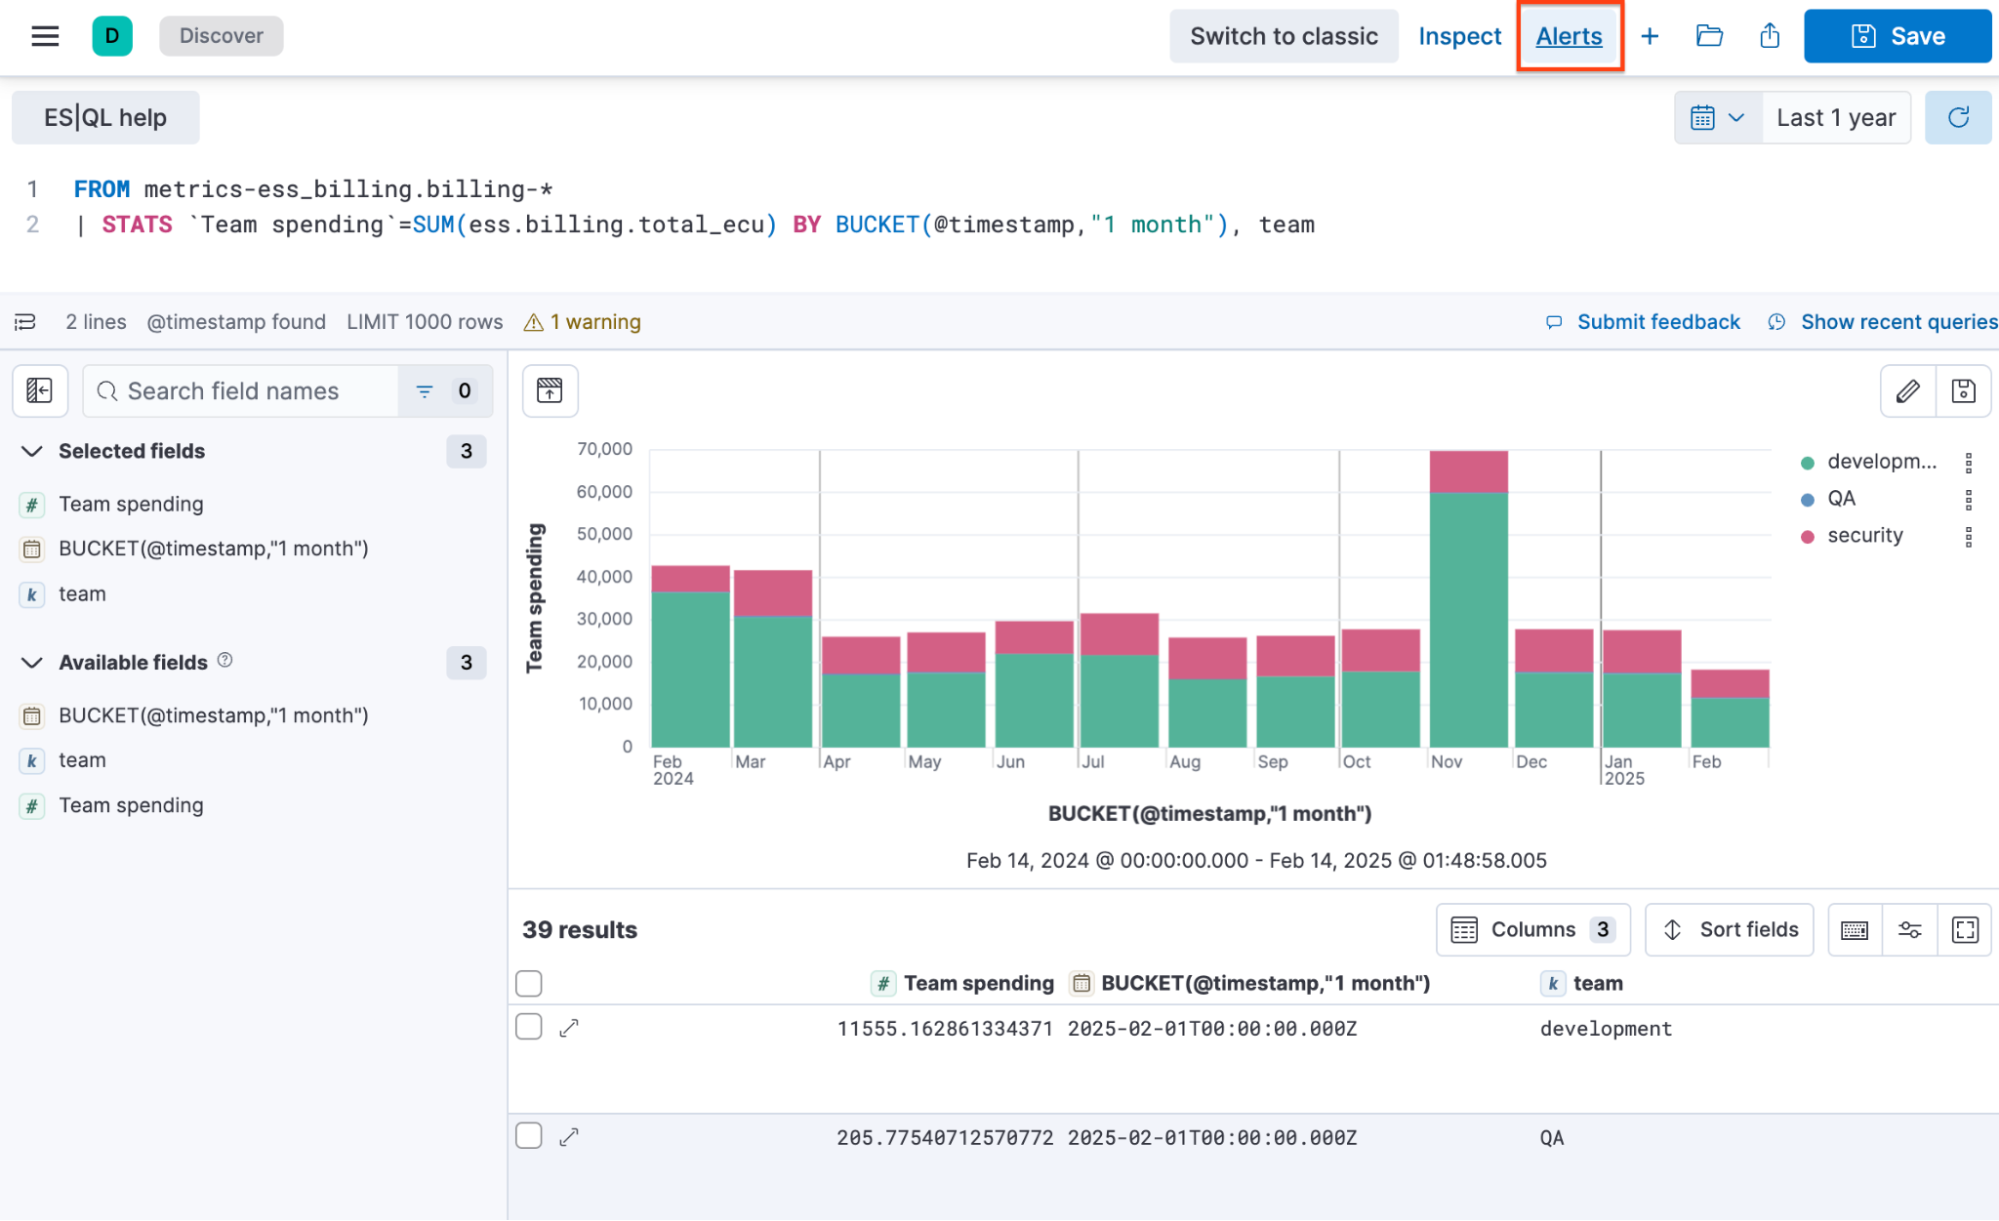
You can now analyse the spending trends of your teams, thanks to this freshly created field. Let’s use some ES|QL for this purpose:
FROM metrics-ess_billing.billing-*
| STATS `Team spending`=SUM(ess.billing.total_ecu)
BY BUCKET(@timestamp,"1 month"), team
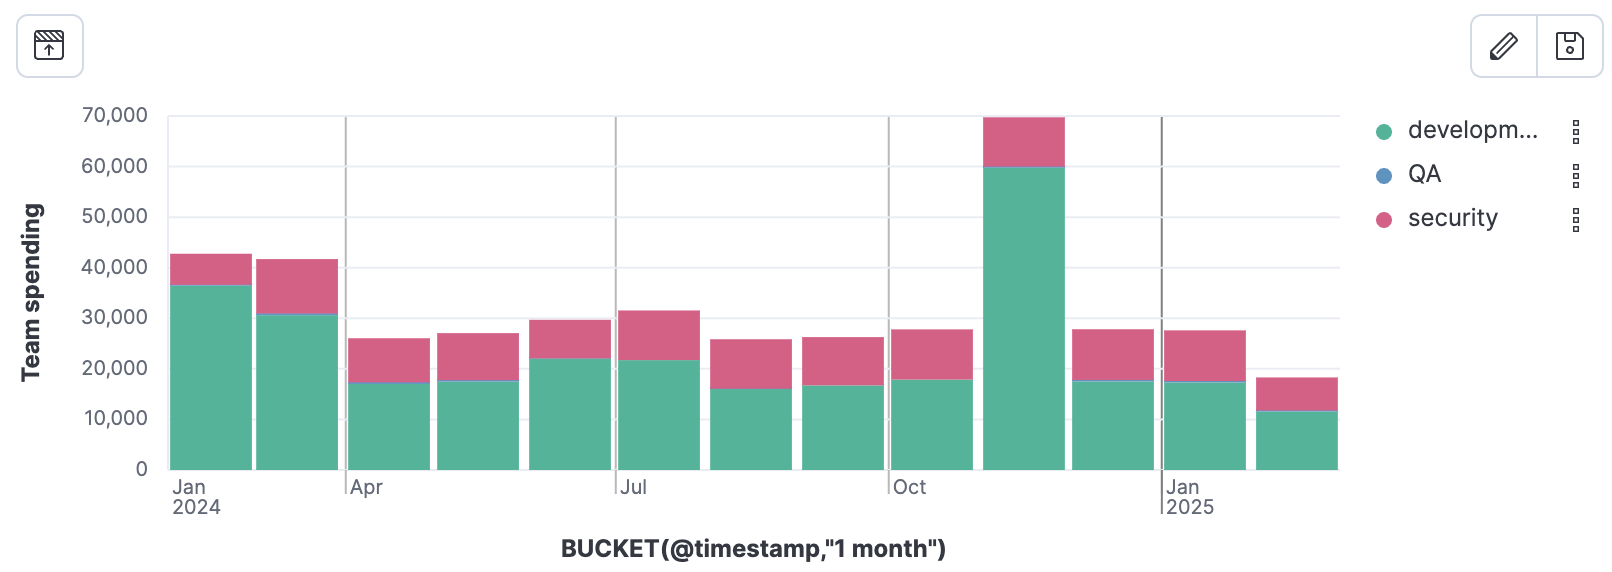
It looks like the trend is fairly stable, except for this large bill in November. Maybe I should configure some alerting to identify the spending trend faster next time.
Setting up alerts for team spending
Monitoring team expenditures is vital for budget management. With Kibana's alerting features, you can configure notifications to alert you when a team's spending trend surpasses a predefined threshold — let’s prevent this November fluke from happening again.
Since I already queried for the data and wrote the ES|QL query, most of the work is already done! I can simply click on the Alerts button at the top of my screen and change my configuration and threshold to match my goals.
In my case, I will refine the granularity to daily spending and set a per-team budget of 1,000 ECUs:
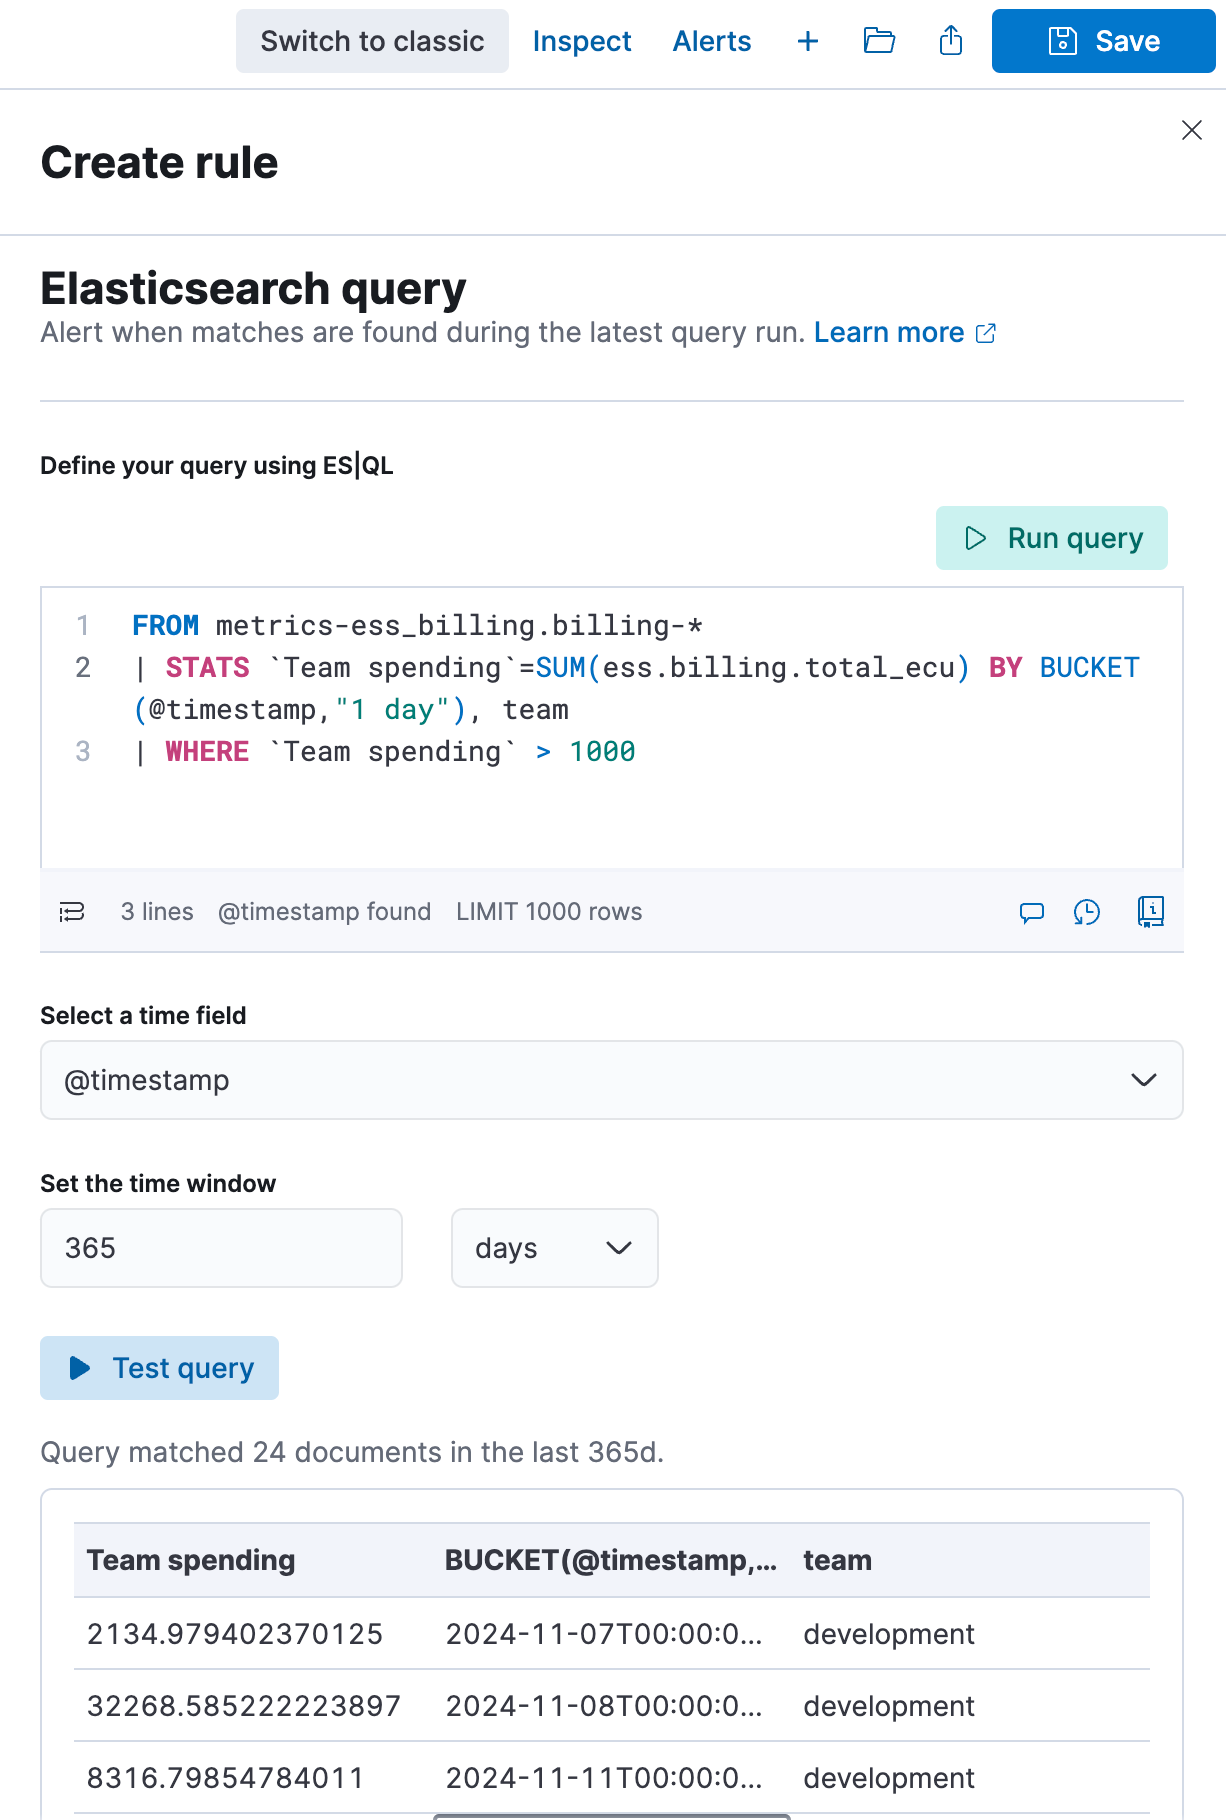
Notice how I can live-test my query and confirm that this would indeed have triggered in November, when my Development team blew the budget.
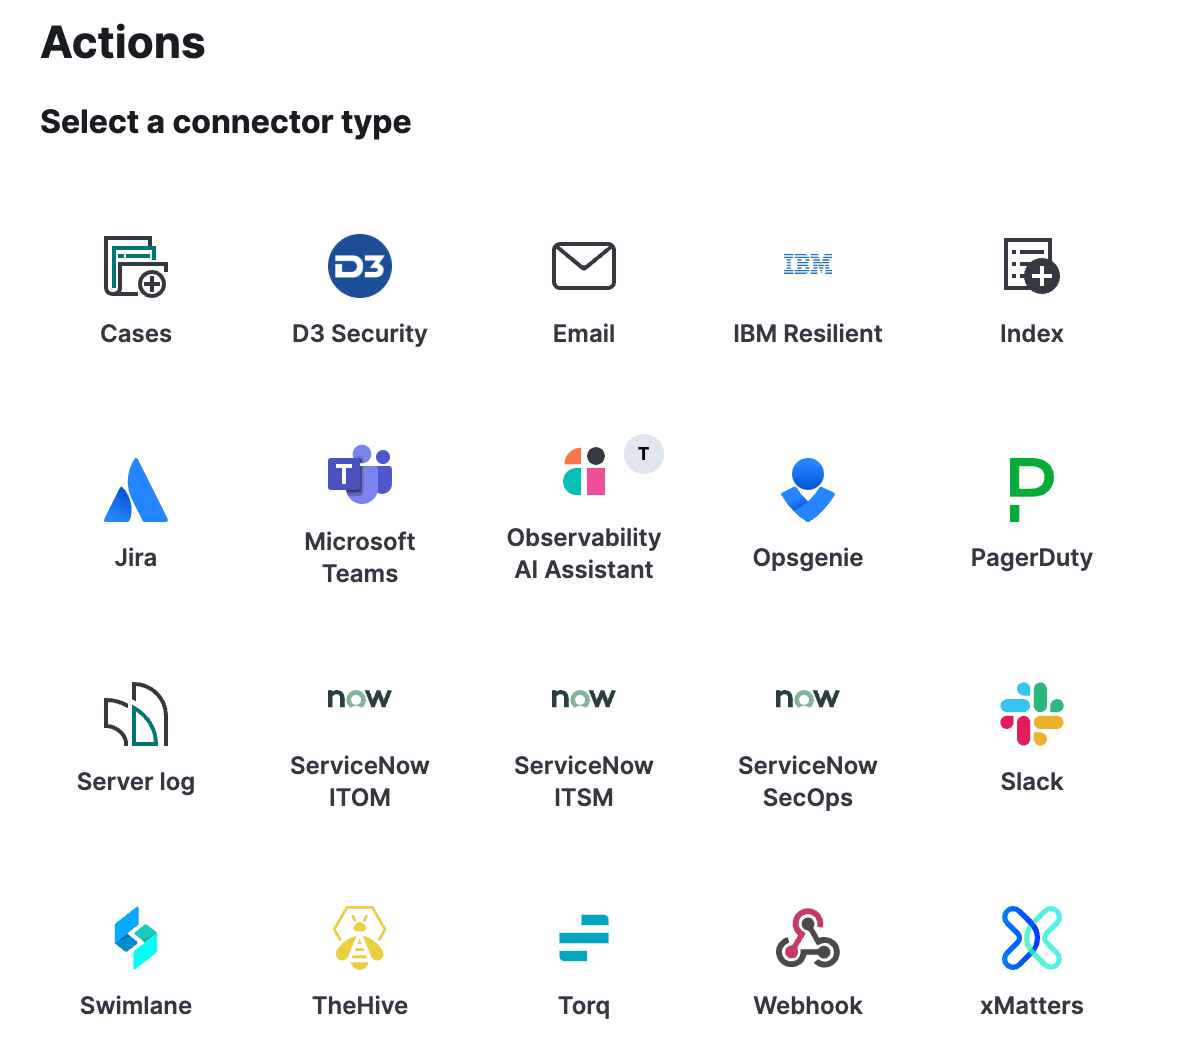
The final step is to configure the action you want Kibana to run on alert trigger. In my case, this will certainly be an email, but you can refer to the documentation for more details about all available connector types.
Take control of your Elasticsearch Service costs
By integrating the Elasticsearch Service Billing data into your observability pipeline, you gain real-time visibility into your cloud spending, ensuring financial accountability across teams. With custom tagging and alerting in Kibana, you can track expenses, enforce budget policies, and prevent unexpected cost overruns.
Ready to take control of your Elasticsearch Service costs? Deploy the integration today, customize it to match your team structure, and set up alerts to stay ahead of budget surprises.
The release and timing of any features or functionality described in this post remain at Elastic's sole discretion. Any features or functionality not currently available may not be delivered on time or at all.
Share
- Share on Twitter
Share on Twitter
- Share on LinkedIn
Share on LinkedIn
- Share on Facebook
Share on Facebook
- Share by Email
Share by email
- Print this page
Print

