Coretek, the largest Azure cloud solution provider in the United States, consolidated its managed security operations center (SOC) and cloud infrastructure monitoring onto a single Elastic platform, run by one joint team that shares a single architect across both practices. Consolidating onto one consumption-based platform let Coretek standardize client onboarding, share context across security and infrastructure, and run both practices on a single cost model.
Summary
Coretek is a managed service provider and the number one Azure cloud solution provider in the United States, delivering managed IT, security, and observability to commercial and public sector clients. Its security and infrastructure teams ran on separate tools, a SIEM whose cost and 90-day retention no longer fit a managed-service model, and an infrastructure monitor that reported thresholds without context. Coretek moved both practices onto Elastic Cloud on Azure, running its managed SOC on Elastic Security and migrating roughly 50 clients off its prior infrastructure monitor onto Elastic Observability in five months. Alert volume fell about 50% across those clients on day one, security alert volume dropped 70%–80% versus the prior SIEM, and retention went from 90 days to a full year on a single platform.
1 platform, 2 practices, a shared team
Coretek manages security and cloud infrastructure for a large book of commercial and public sector clients, ingesting event data across network, server, and user activity and generating thousands of alerts a day. In a managed-service business, that volume is not just an engineering problem, it is tedious, time-wasting work: every false positive a junior engineer chases is capacity Coretek cannot bill against higher-value work. The company had been running its security and observability practices on separate tools with separate cost models and no shared context. Its answer was to consolidate both onto one Elastic platform, run by a joint platform team that spans the two business units and shares a single Elastic architect. That move meant fewer but more meaningful alerts, shared context across teams, and junior engineers who could assess and escalate faster instead of working through the noise.
"We don't want our NOC just looking at false positives all day. They're our junior engineers, they should be resolving events end to end, writing the knowledge-base article, and escalating the real problems. Cutting the noise gives us that capacity back."
Why Coretek put both practices on one platform
Coretek is a large Microsoft partner and the number one Azure cloud solution provider in the United States, hosting its Elastic deployment on Azure and running most client estates inside the Azure ecosystem. Elastic entered the picture on the security side about 18 months ago, as clients matured and hit the cost and retention limits of their existing SIEM. As those bills climbed, Coretek needed a better-fitting, lower-cost option to bring to clients, and Elastic became that option.
The turning point was a single client. As Coretek finished onboarding the client's data into the prior SIEM, the monthly bill landed just under $20,000. Coretek ran the same coverage on Elastic and brought it to the client for roughly $4,000. That comparison became the internal case for leading with Elastic rather than the incumbent SIEM.
Once security was proven, Coretek's infrastructure team adopted the same platform for observability, replacing the tool it had used for monitoring. The decision was as much about the operating model as the technology: a consumption-based platform that grows with the business instead of a prepaid, add-on-by-add-on model, plus the ability to share resources, best practices, and a single architect across two teams that had previously run their own tooling.
"A new client's monthly SIEM bill came in just under $20,000. We showed them the same coverage on Elastic for about $4,000. That was the moment it clicked internally: This is the solution we lead with now."
Before: 2 toolsets, 2 cost models, no shared context
On the security side, the prior SIEM's cost scaled unpredictably as ingest grew, and it was especially expensive for non-Microsoft data. Its 90-day retention could not meet the one-year audit-log mandate most clients carry, so clients had to find and pay for a separate retention store. Bringing in a new data source was a multi-day setup effort, and automation was limited. The practical result was that SIEM cost frequently blew client budgets, and Coretek lost deals on price.
On the observability side, the prior infrastructure monitor reported a breached threshold and little else: A resource had hit 90% utilization, and an engineer was left to go figure out why. The answer was usually in the logs, but the old tool stopped at the threshold, so finding it meant leaving the alert and searching elsewhere. New capabilities tended to arrive as separate purchasable add-ons, and the prepaid resource model did not grow smoothly with the business.
Across both practices, engineers spent their time jumping between consoles and assembling context by hand.
Streamlining client onboarding on the same Elastic platform
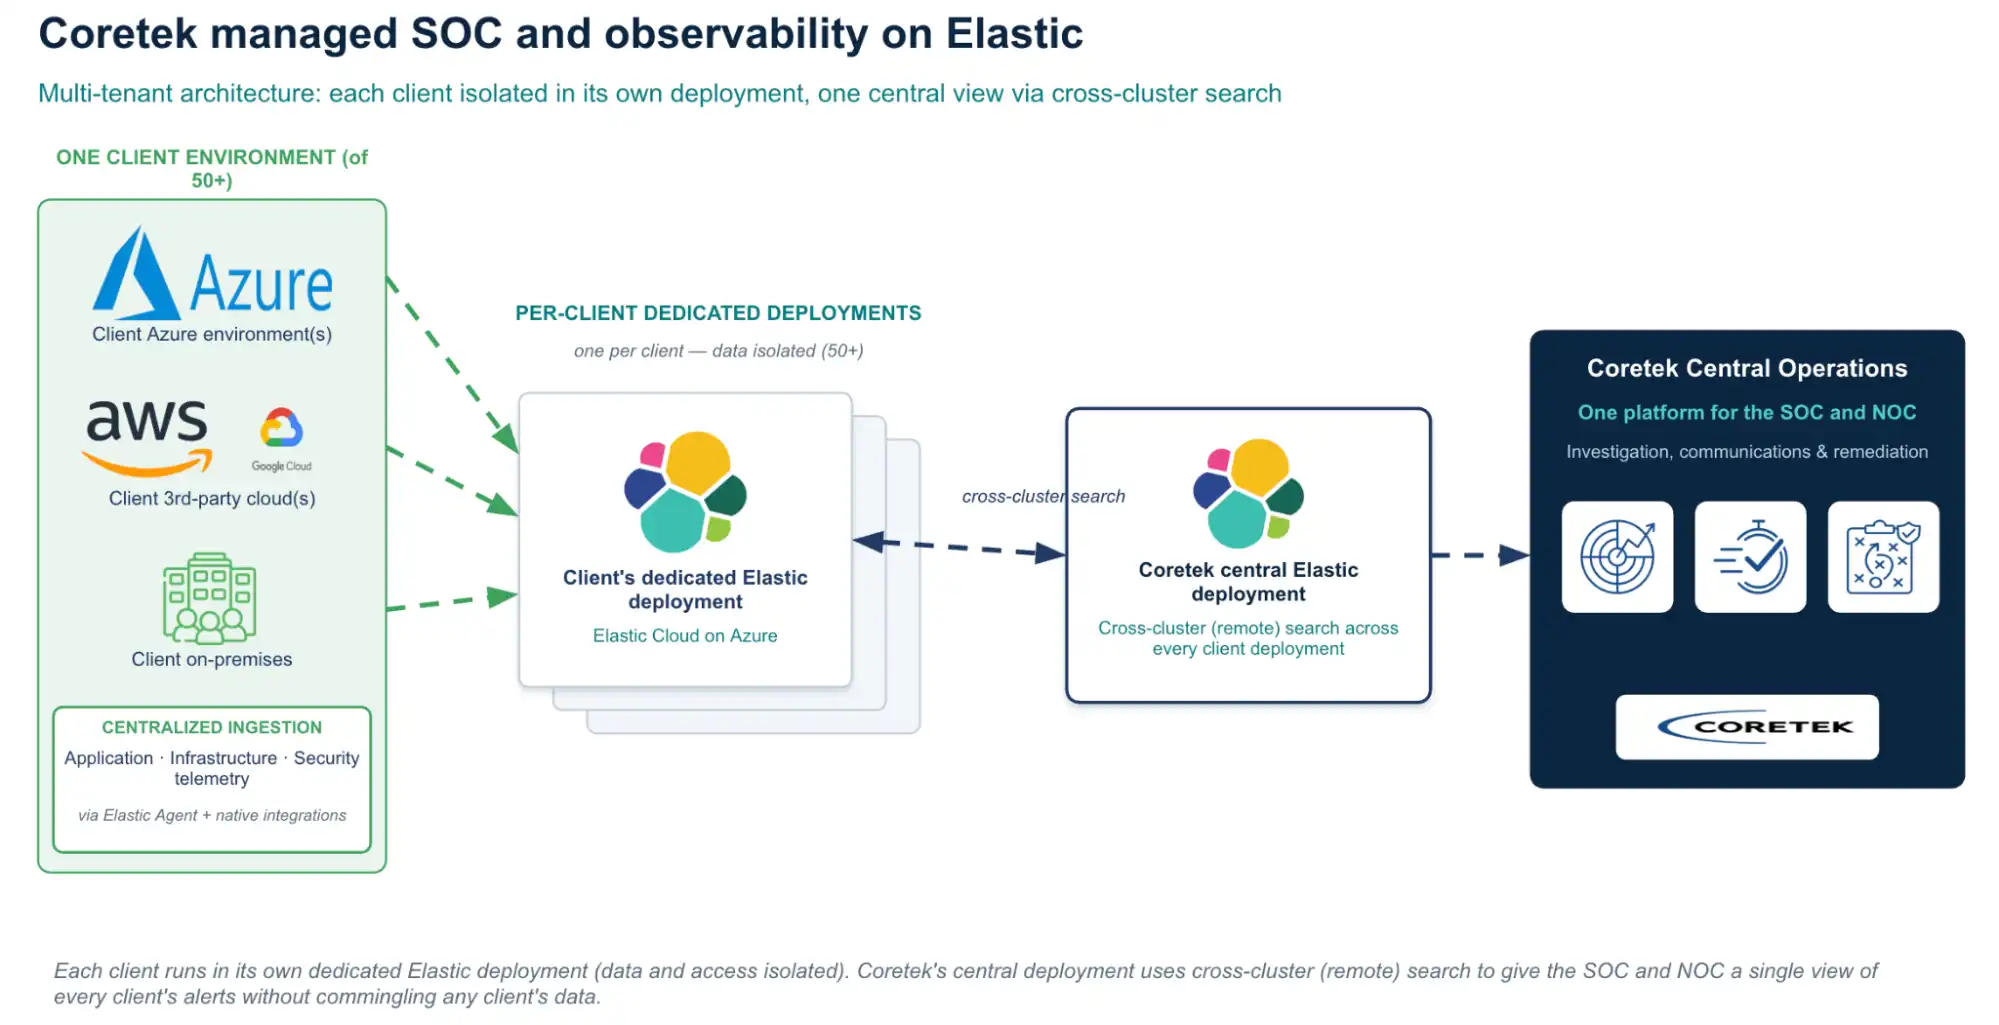
Coretek runs both practices on Elastic Cloud hosted on Azure. Elastic Agent is deployed across client servers for native infrastructure and endpoint telemetry, and Azure logging and event hubs feed in alongside it. Data lands either in Coretek's multitenant environment or, for clients who want it, in the client's own Azure tenant provisioned through the Azure Marketplace. Detection runs on Coretek's own centrally managed rule set, which it rolls out across clients through Elastic's APIs, together with Agent Builder, and investigation and monitoring surface in Kibana, with related context assembled on the alert timeline where NOC and SOC engineers work.
The onboarding path is one of the clearest expressions of the whole model. Because most of what is available in the interface is also available as an API call, Coretek scripted client onboarding end to end: An intake form and a single button deploy the Elastic tenant, configure single sign-on, create the initial collection policies from the client's declared data sources, and stand up the Azure event hubs and logging. A new client can go from kickoff call to a functioning SIEM and observability platform in an afternoon.
Rule migration is automated in the same spirit. Automatic Migration translates existing detection rules from Splunk, Sentinel, or QRadar into Elastic rules, tagged to the relevant source data and mapped to MITRE ATT&CK, so a screenshot of a legacy rule becomes a managed, code-tracked detection.
Technical highlights
- Elastic Cloud on Azure; each client runs in its own dedicated Elastic deployment, with a central Coretek deployment running remote search across them so the SOC sees all clients' alerts in one place; capacity purchased as consumption (Elastic Consumption Units)
- Client-owned deployments provisioned through the Azure Marketplace into the client's own Azure tenant
- Elastic Agent for native infrastructure and endpoint telemetry across client servers
- Non-Microsoft sources ingested natively: Palo Alto Networks, Fortinet, Oracle, on-prem infrastructure, Citrix, AVD, networking, and custom in-house applications
- Centralized rule rollout that Coretek scripted through Elastic's APIs: change a detection once, push it across the client base
- Rule translation via Automatic Migration from Splunk, IBM QRadar, or Sentinel, with MITRE ATT&CK mapping
- Broad API coverage: Automated tenant provisioning, SSO, collection policies, and Azure event hubs in one scripted workflow
- 365-day on-platform retention, meeting one-year audit requirements without a separate store
- Data volume: Security ingest spans network, server, and user-activity sources at high volume
What the platform does
A managed SOC on a single back end
Coretek runs its managed SOC on Elastic Security as the SIEM back end for its MSSP services. Consolidating Microsoft and non-Microsoft security data in one place ended the console-hopping that the prior stack forced, where even Microsoft endpoint data lived in a second console the analyst had to search separately. Against a prior SIEM deployment, Coretek reports a 70%–80% reduction in alert volume, built up over a roughly 10–12 month head start on the security side. The move to 365-day retention also changed what analysts can answer: A question like whether a given IP address or file hash was seen nine months ago, previously impossible under a 90-day cap, is now a single query on the same platform that holds the audit logs.
Fewer alerts, and the context to act on them
On the observability side, Coretek migrated roughly 50 clients off its prior infrastructure monitor onto Elastic Observability for infrastructure monitoring. Where the old tool reported a breached threshold and stopped, Elastic carries the surrounding data an engineer needs to understand why and get to a root cause. On day one, near out-of-box and with little tuning, alert volume across those clients fell about 50%. With thousands of alerts a day, halving the volume lets the NOC focus on what matters, which in turn helps mean time to resolution. Coretek is now working to push further with AIOps and machine learning, using anomaly detection to suppress normal cyclical behavior and reduce alert noise again.
Ingest anything, then act on it
Both gains rest on the same foundation: the flexibility to bring in any source, normalize it, and treat it like any other data. Built on Elasticsearch, the platform lets Coretek ingest not just Microsoft and Azure sources but Palo Alto Networks, Fortinet, Oracle, and clients' own homegrown business applications, and act and report on all of it uniformly. A new data source that was a multi-day setup effort on the prior SIEM is roughly a five-minute job on Elastic, whatever the source. For a security team whose priorities can change day to day, that flexibility is the difference between protecting what the business actually values and protecting only what the tool made easy.
From kickoff to a live platform in an afternoon
The clearest way to see the change is in the day-to-day. When Coretek onboards a new client, the scripted provisioning stands up a working SIEM and observability platform in an afternoon rather than over a multiweek project, and new sources come online in minutes. When an engineer opens an alert, the relevant data is already in one back end and much of it is assembled on the timeline, so the work starts from context rather than from a blank search across separate consoles.
"For almost every alert, all the data is already in one place, and a lot of it is surfaced on the timeline for you. Elastic is building the puzzle before you even open the alert, so it's far less time digging across tools."
Before and after
| Before | After | |
|---|---|---|
| Alert management | Thousands of alerts a day, heavy false positives | Roughly 50% fewer alerts (observability); 70%–80% fewer (security) |
| Operational effort | Separate tools per domain, capabilities bought add-on by add-on | One platform, consumption-based, shared across security and infrastructure teams |
| Investigation flow | Console-hopping between the SIEM and endpoint tooling; threshold-only infrastructure alerts | Data in one back end, context assembled on the timeline, root cause available |
| Institutional knowledge | Rules and know-how siloed per tool | Coretek's centrally managed rules, scripted via Elastic's APIs and rolled out across the client base |
| Retention and audit | 90-day retention, separate store for one-year audit logs | 365-day on-platform retention, one-year audit answered in a single query |
| Analyst and engineer role | Triage, console-hopping, chasing context | NOC engineers resolve end to end and escalate real problems; SOC analysts move to judgment |
| Onboarding | New data source a multi-day setup effort | Kickoff to a live platform in an afternoon; roughly five-minute source ingest |
What comes next?
Coretek has already reclaimed real capacity by halving alert volume, and the roadmap builds directly on that result. The team is building on the anomaly detection and machine learning it has already started using, and extending Agent Builder, to cut alerts again and move toward auto-remediation, and it is expanding into application performance monitoring to reach the 60 managed-services clients it is onboarding next and the 200-plus cloud-solution-provider clients beyond them. Coretek is also evaluating Elastic Agent Builder and Elasticsearch for its own AI development. Its stated ambition is to become a leading Microsoft data and AI partner, with Elastic foundational to the visibility, governance, and cost control that AI adoption demands. As Rishad Anwar, architecture and engineering lead at Coretek, puts it, the platform has become the default for anything new the business takes on.
In a managed-service market defined by constant margin pressure, Coretek treats platform economics, flexibility, and modern machine learning and AI capabilities as the competitive edge that keeps it in business and lets it deliver better service to clients. Your organization may not be running a multitenant MSP platform across 50-plus client estates today, but the same principles apply whether you are consolidating your first two tools or scaling to hundreds of client environments.
"Elastic is our platform of choice now. When anything new comes up, the first question we ask is: Can we use Elastic for that?"
Related resources
Topics: Managed SOC, MSSP, SIEM, infrastructure monitoring, APM, AIOps, alert reduction, Elastic Security, Elastic Observability, Elasticsearch, Elastic Cloud on Azure, multitenant, log retention, Software & Technology
See how running security and observability on one Elastic platform consolidates your data and cuts alert noise, or start now with a free trial.