

Elastic Security: Detect and respond to threats with SIEM
Overview
Introduction to Elastic Security
Elastic Security gives you the ability to address threats at scale with the Elastic Search AI platform. Reduce many alerts to the few that matter and easily investigate the relevance of the results quickly. Break down data silos and get visibility across your attack surface and the ability to dive deep so you can address threats at scale.
Let's get started
Create an Elastic Cloud project
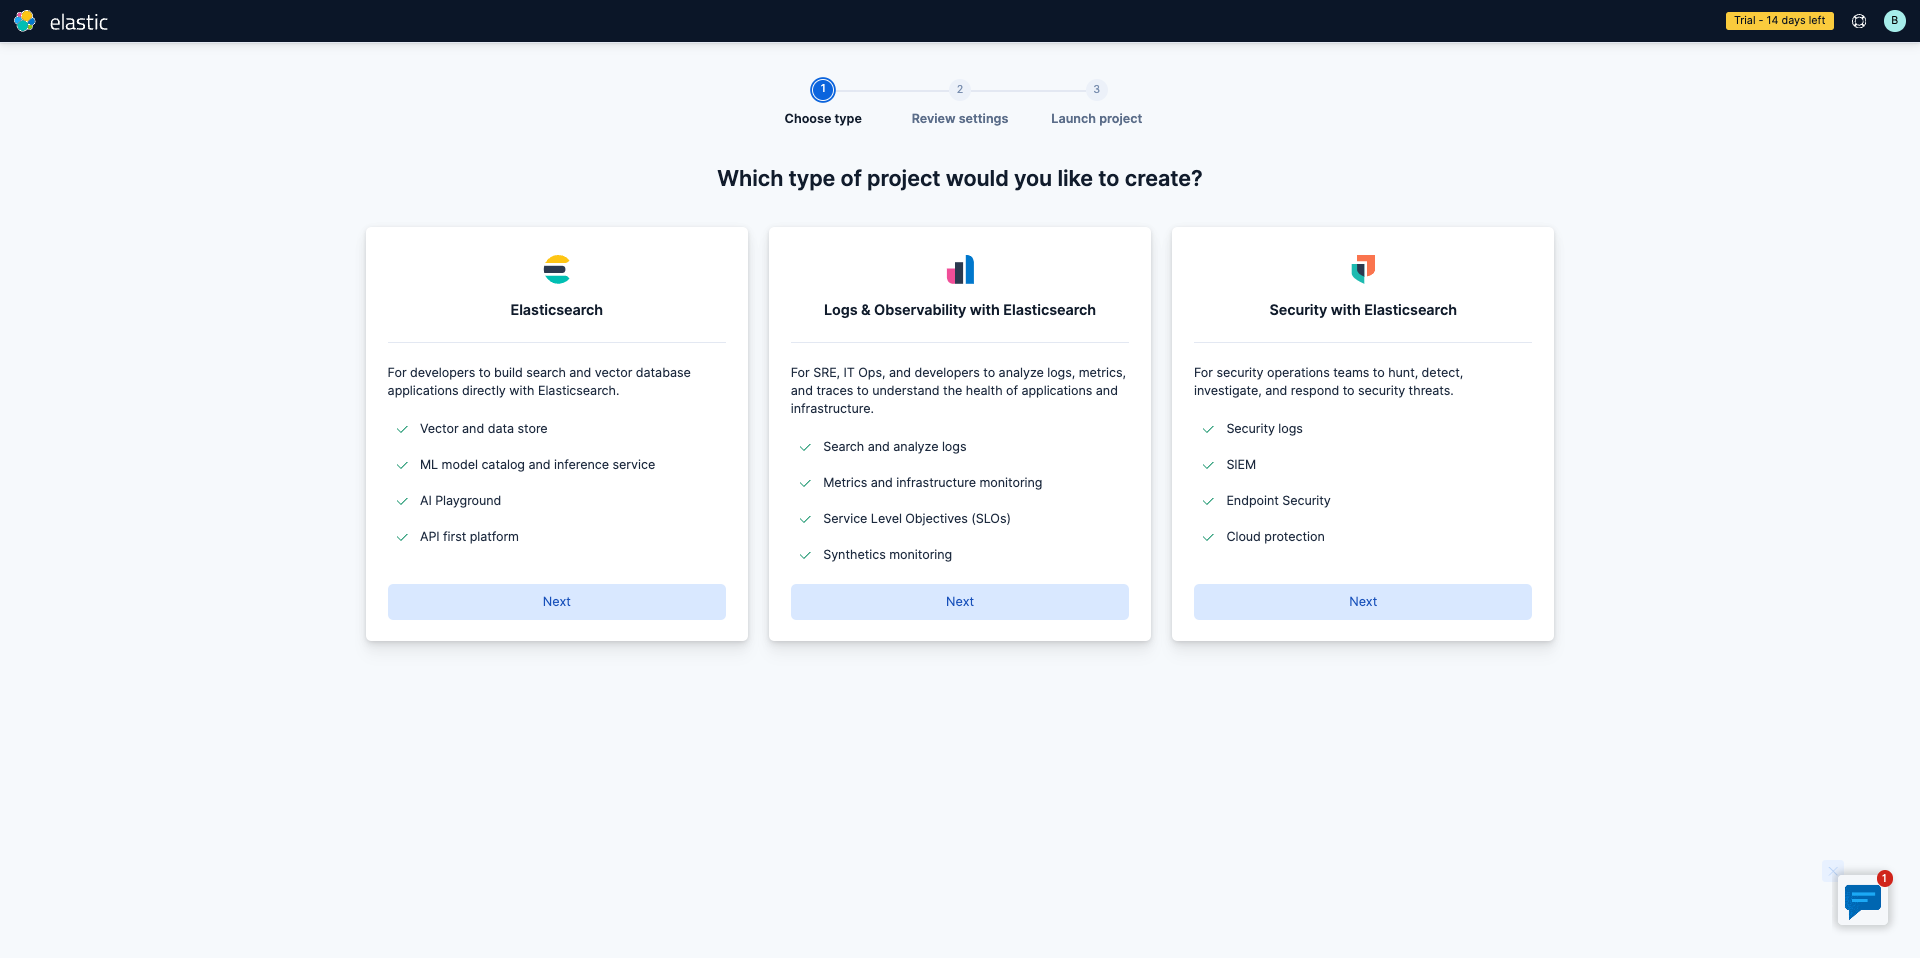
Get started with a 14-day trial. Once you go to cloud.elastic.co and create an account. Be sure to select Security with Elasticsearch then SIEM and Security Analytics. In addition, you should select if you're migrating data from somewhere (for the purpose of this guide we'll select "no"), your preferred cloud regions then when you create your first project.
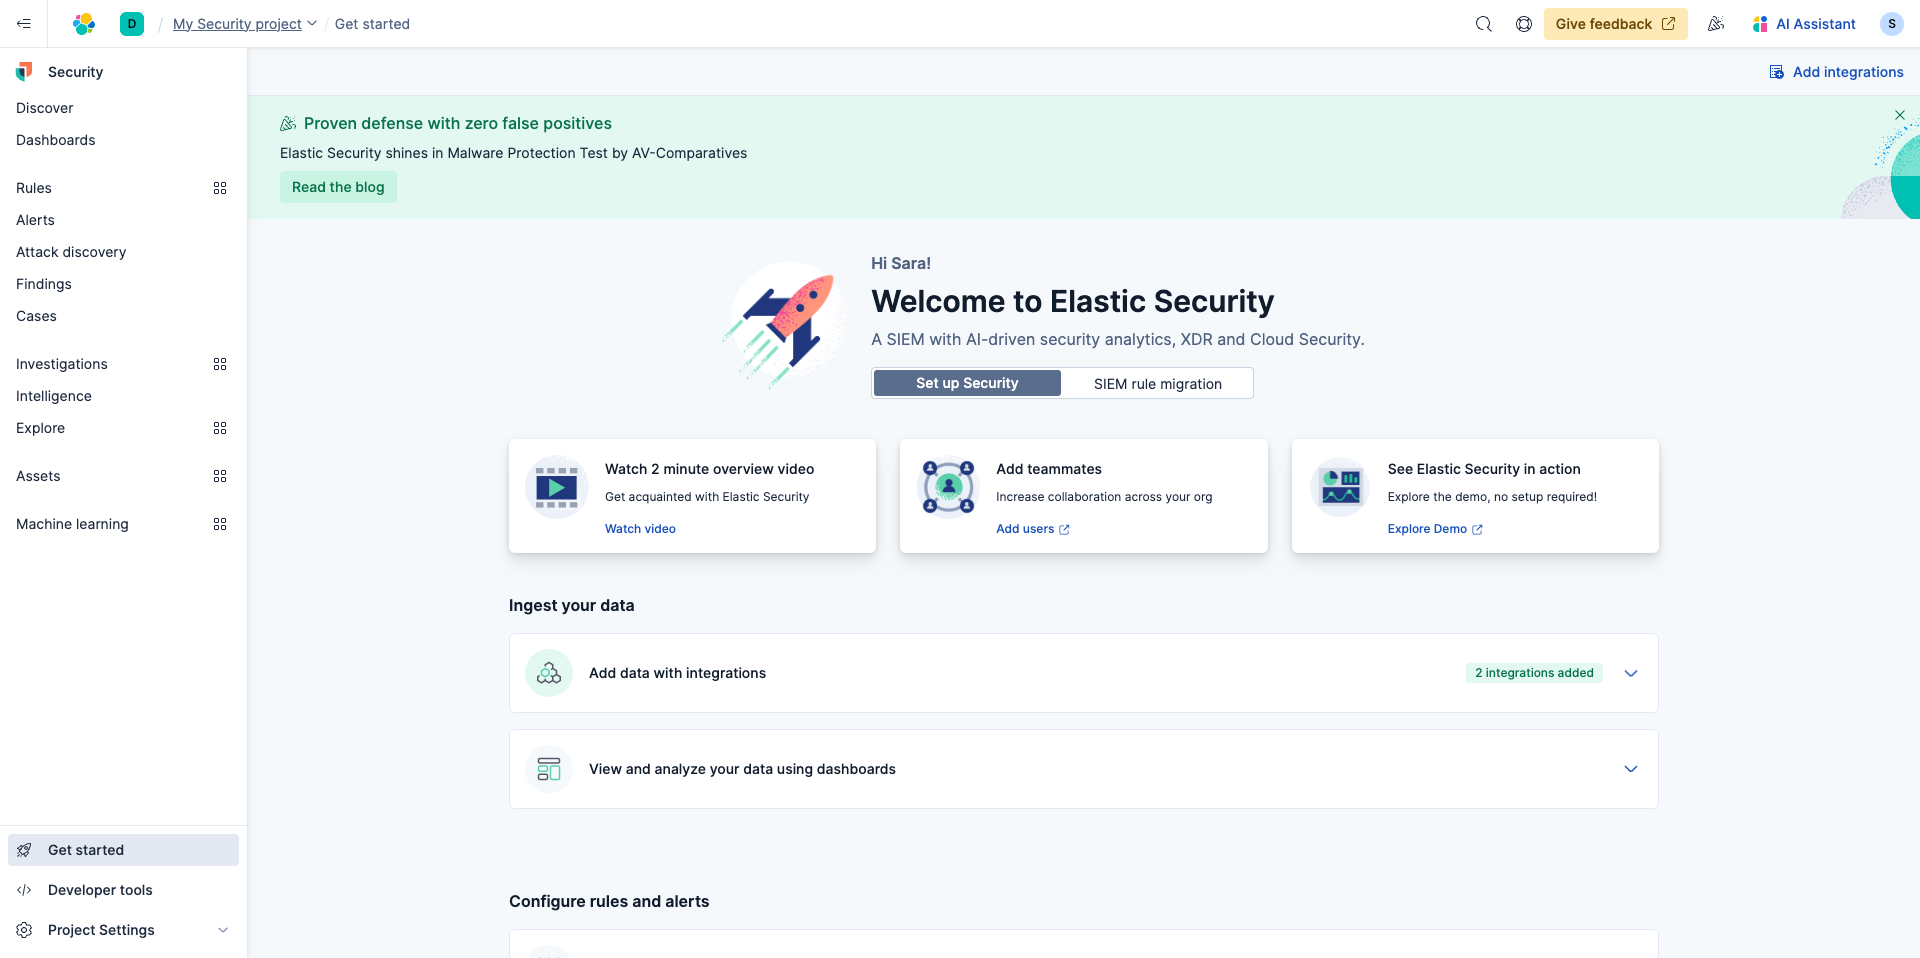
After creating your project you'll be brought to the following screen. At the bottom simply select Add data with integrations and select Elastic Defend.
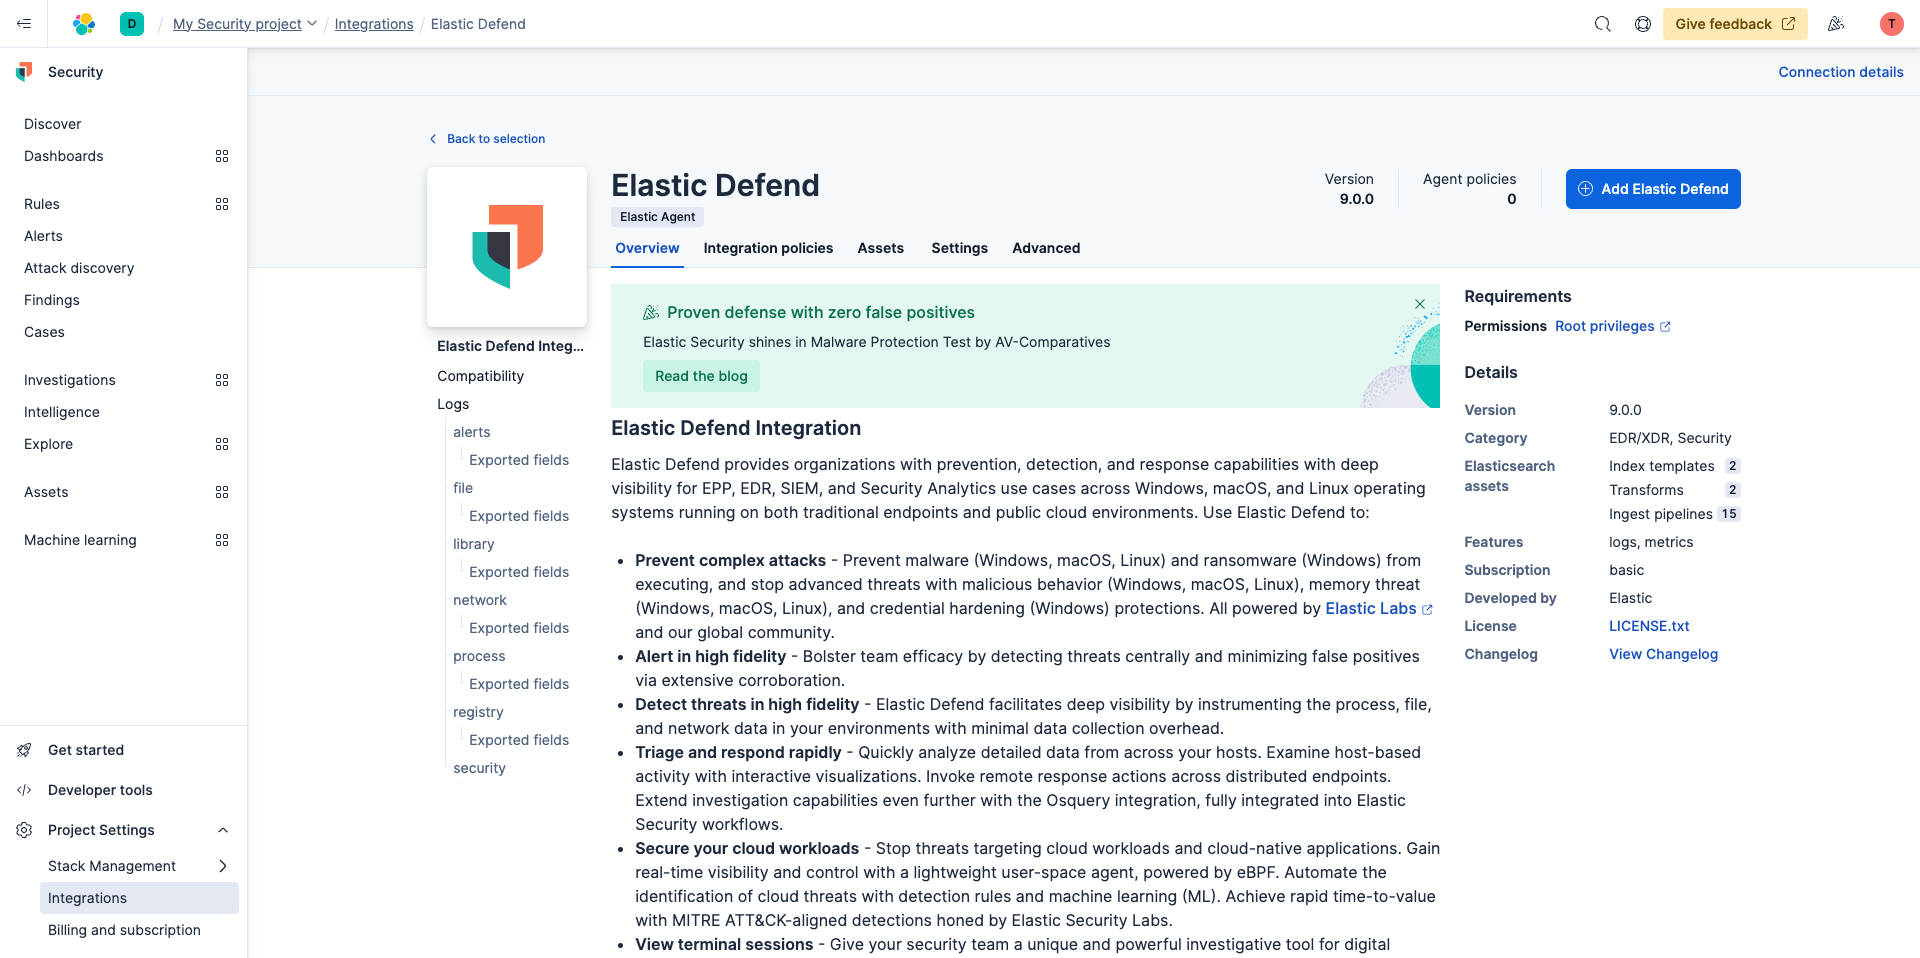
Now you're going to select Elastic Defend then click Add Elastic Defend.
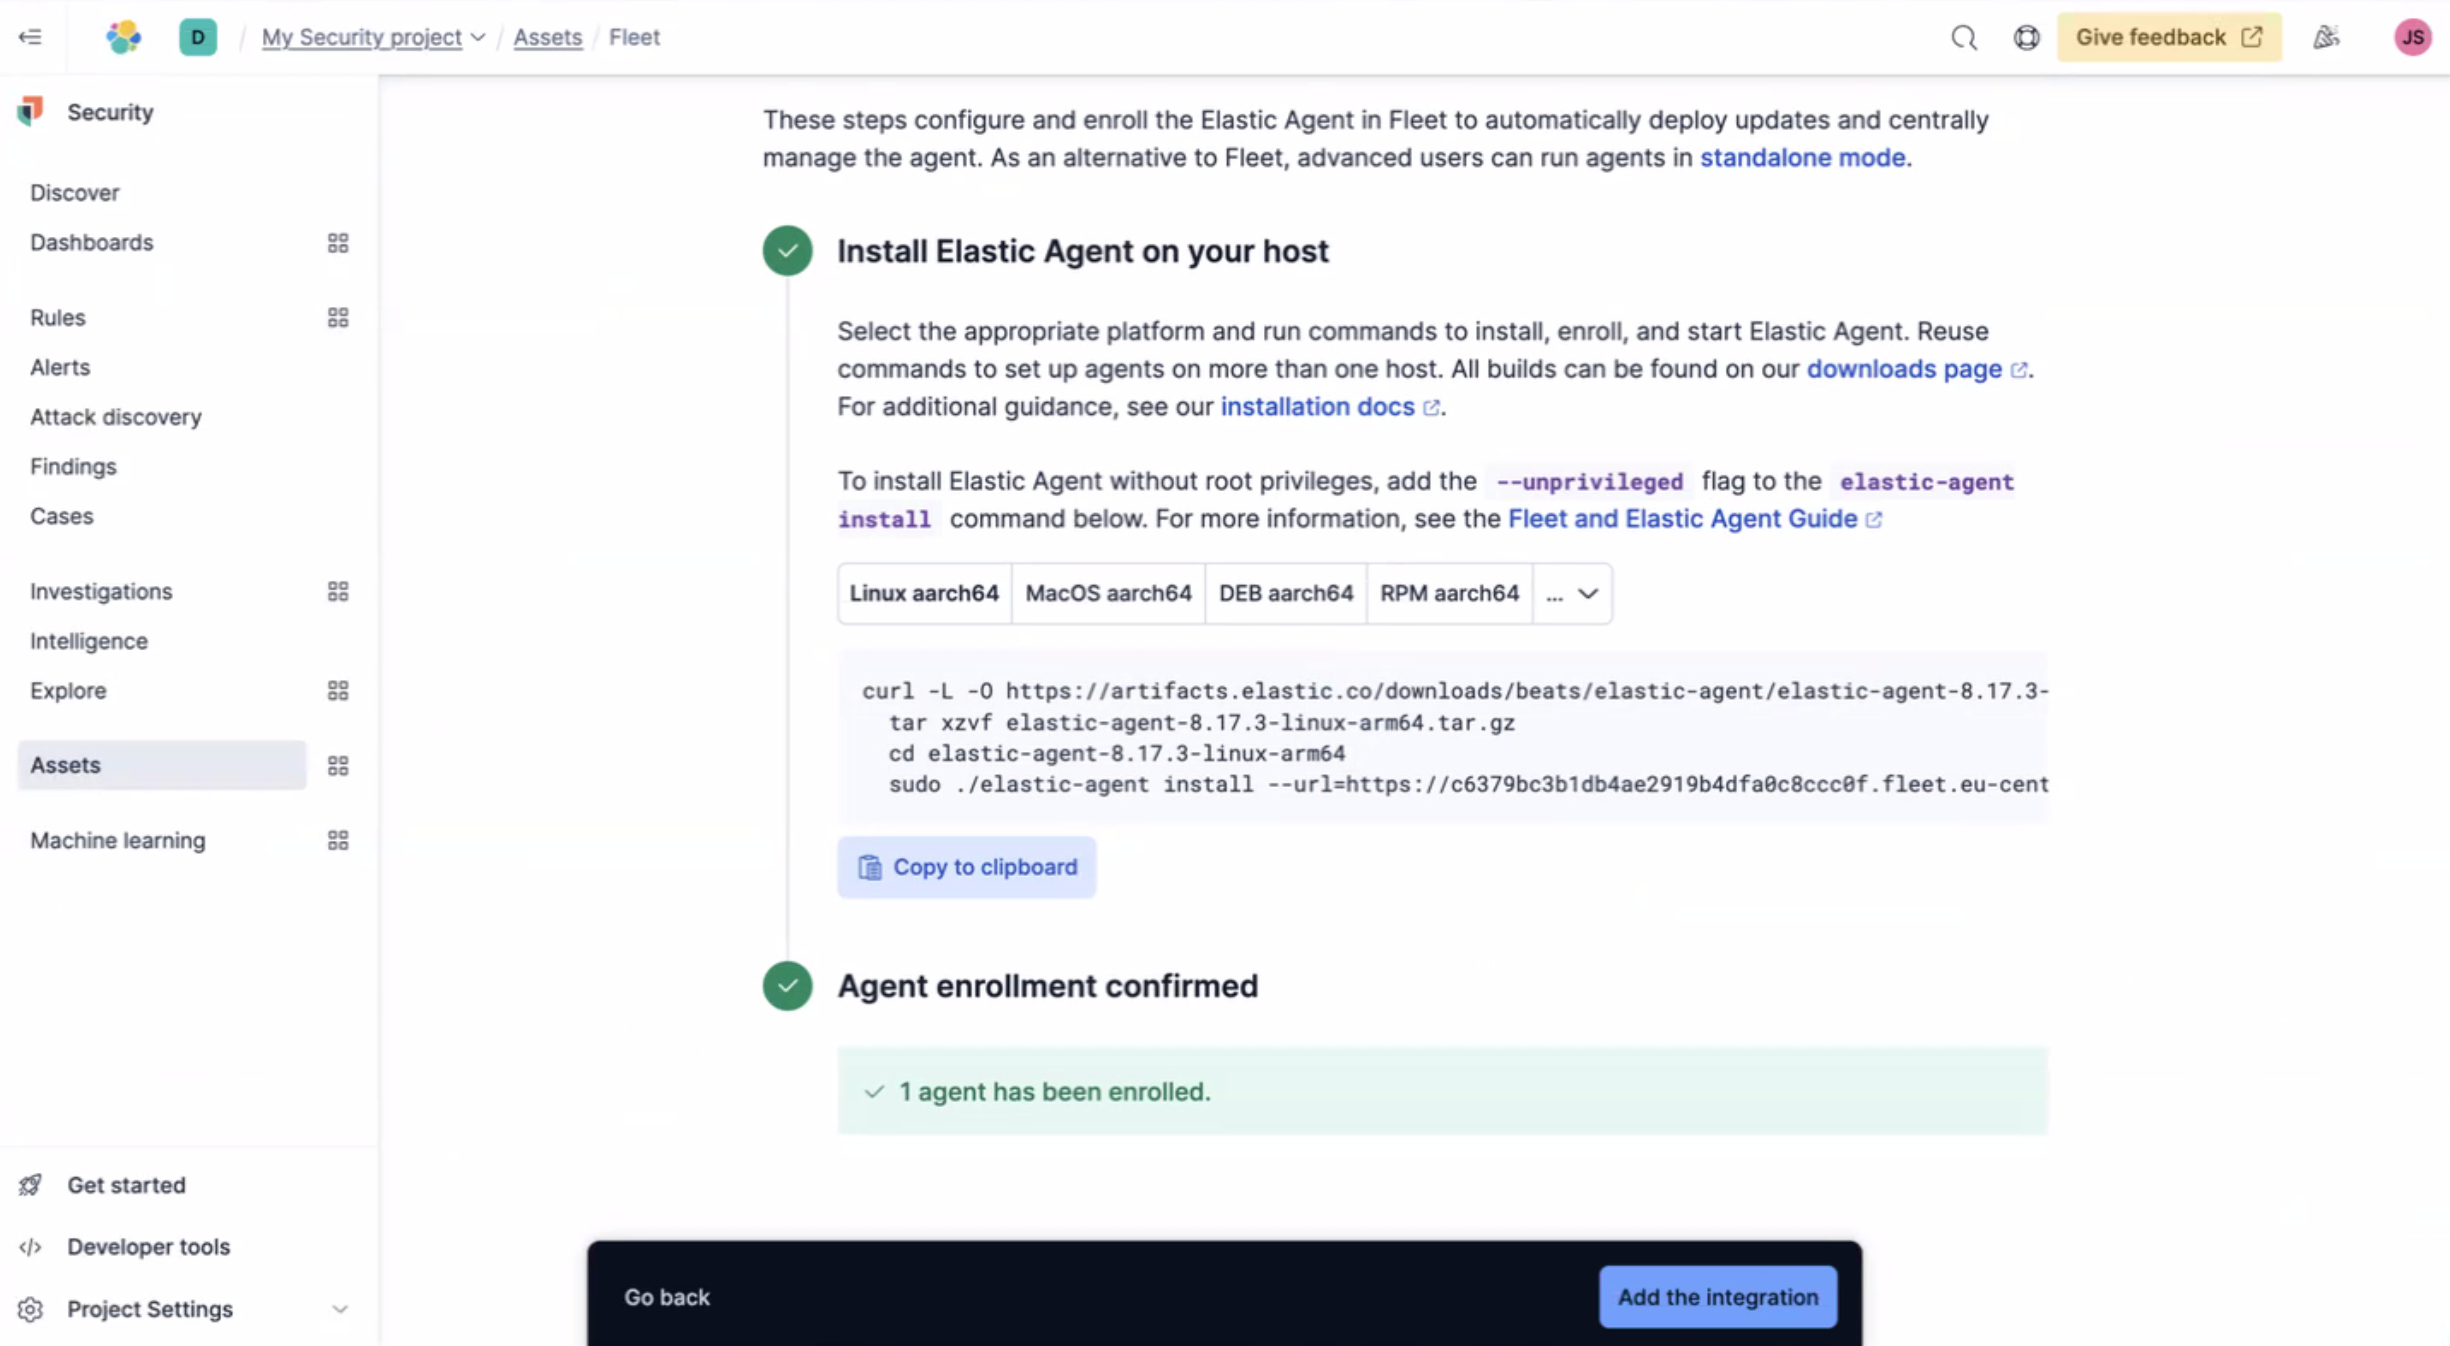
To set up the Elastic Defend integration, you'll first need to install the Elastic Agent on your host. Simply copy the code into your terminal.
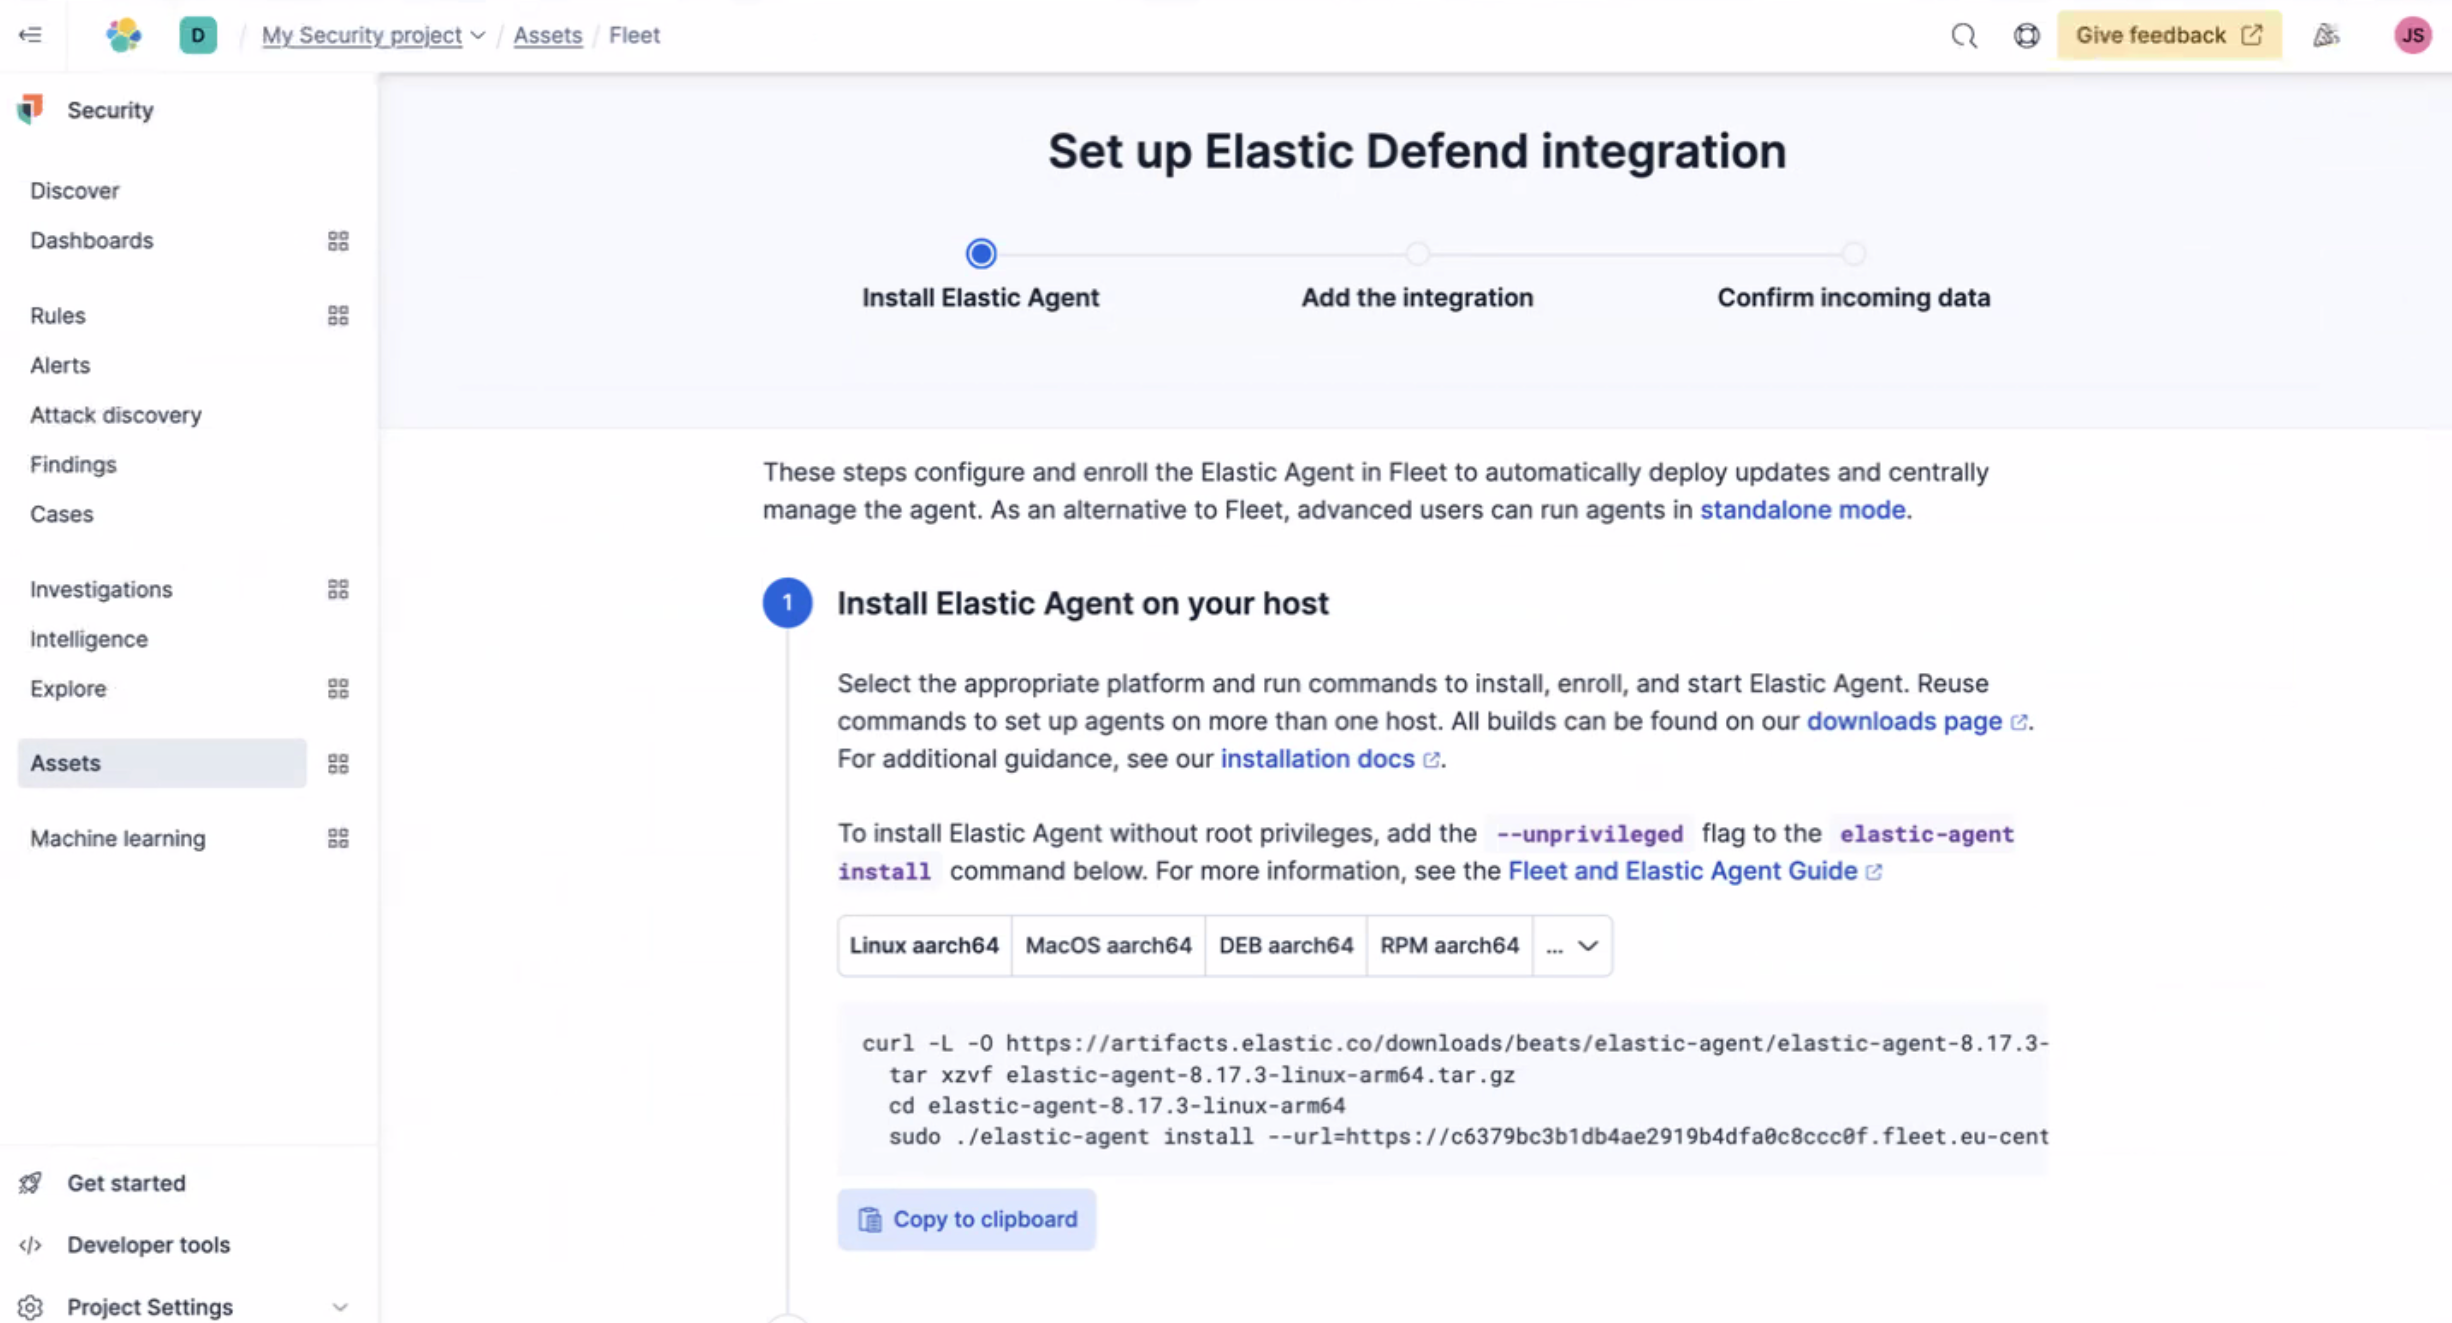
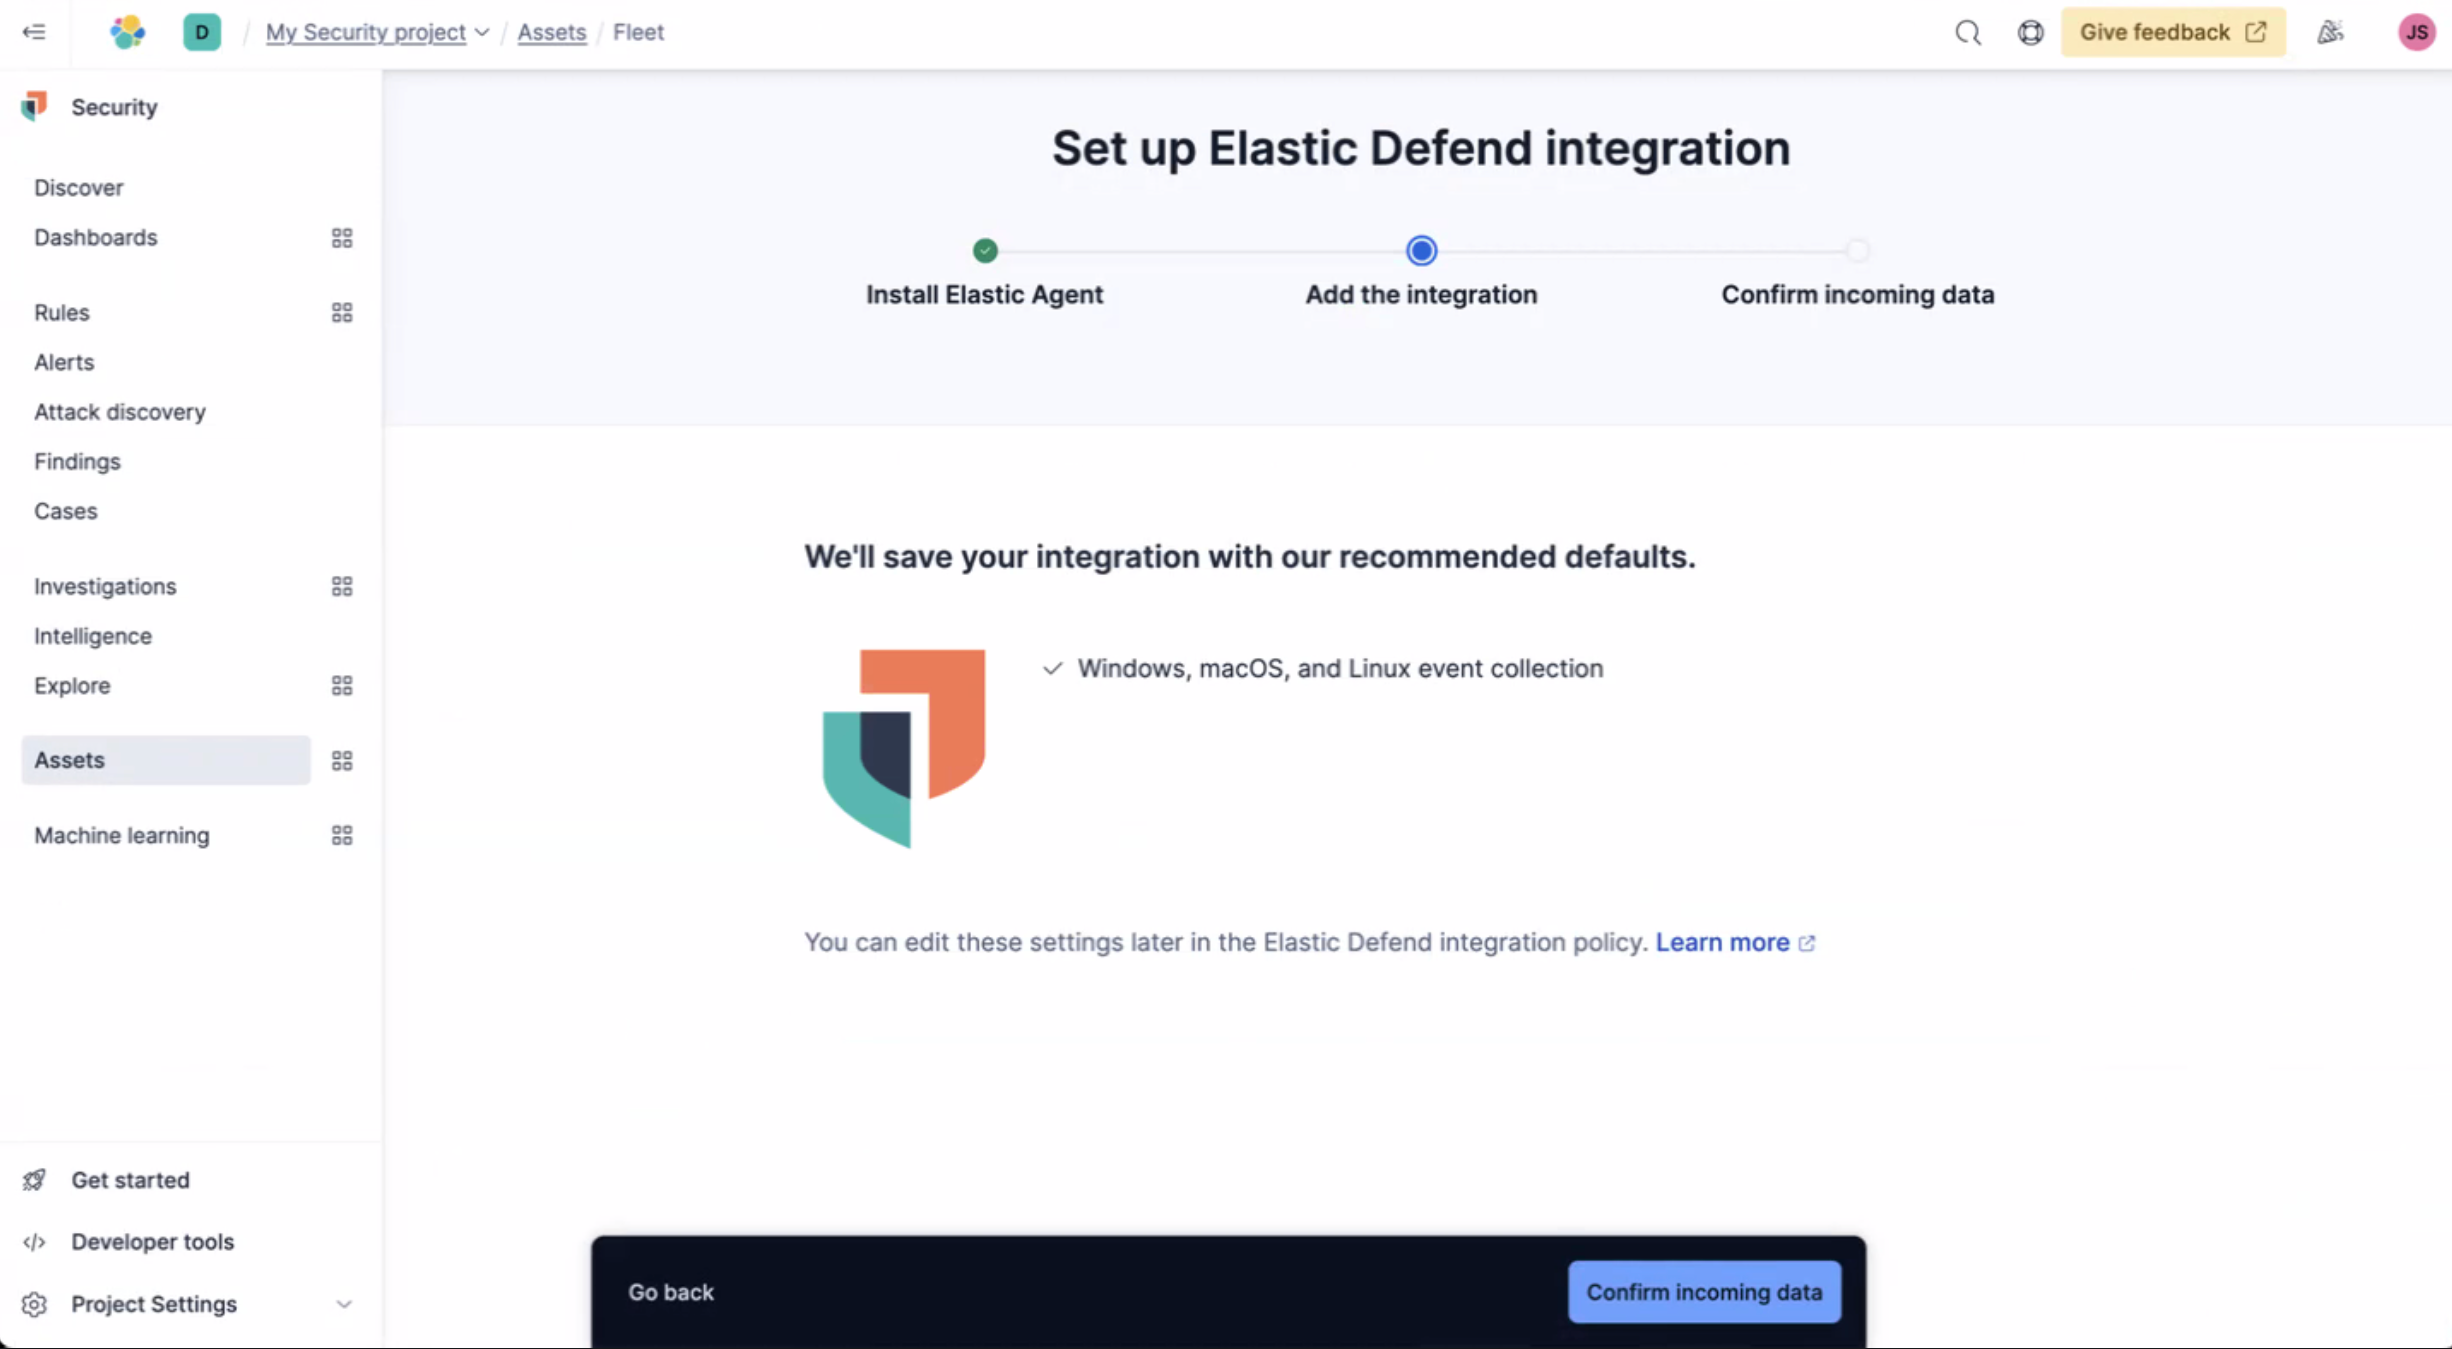
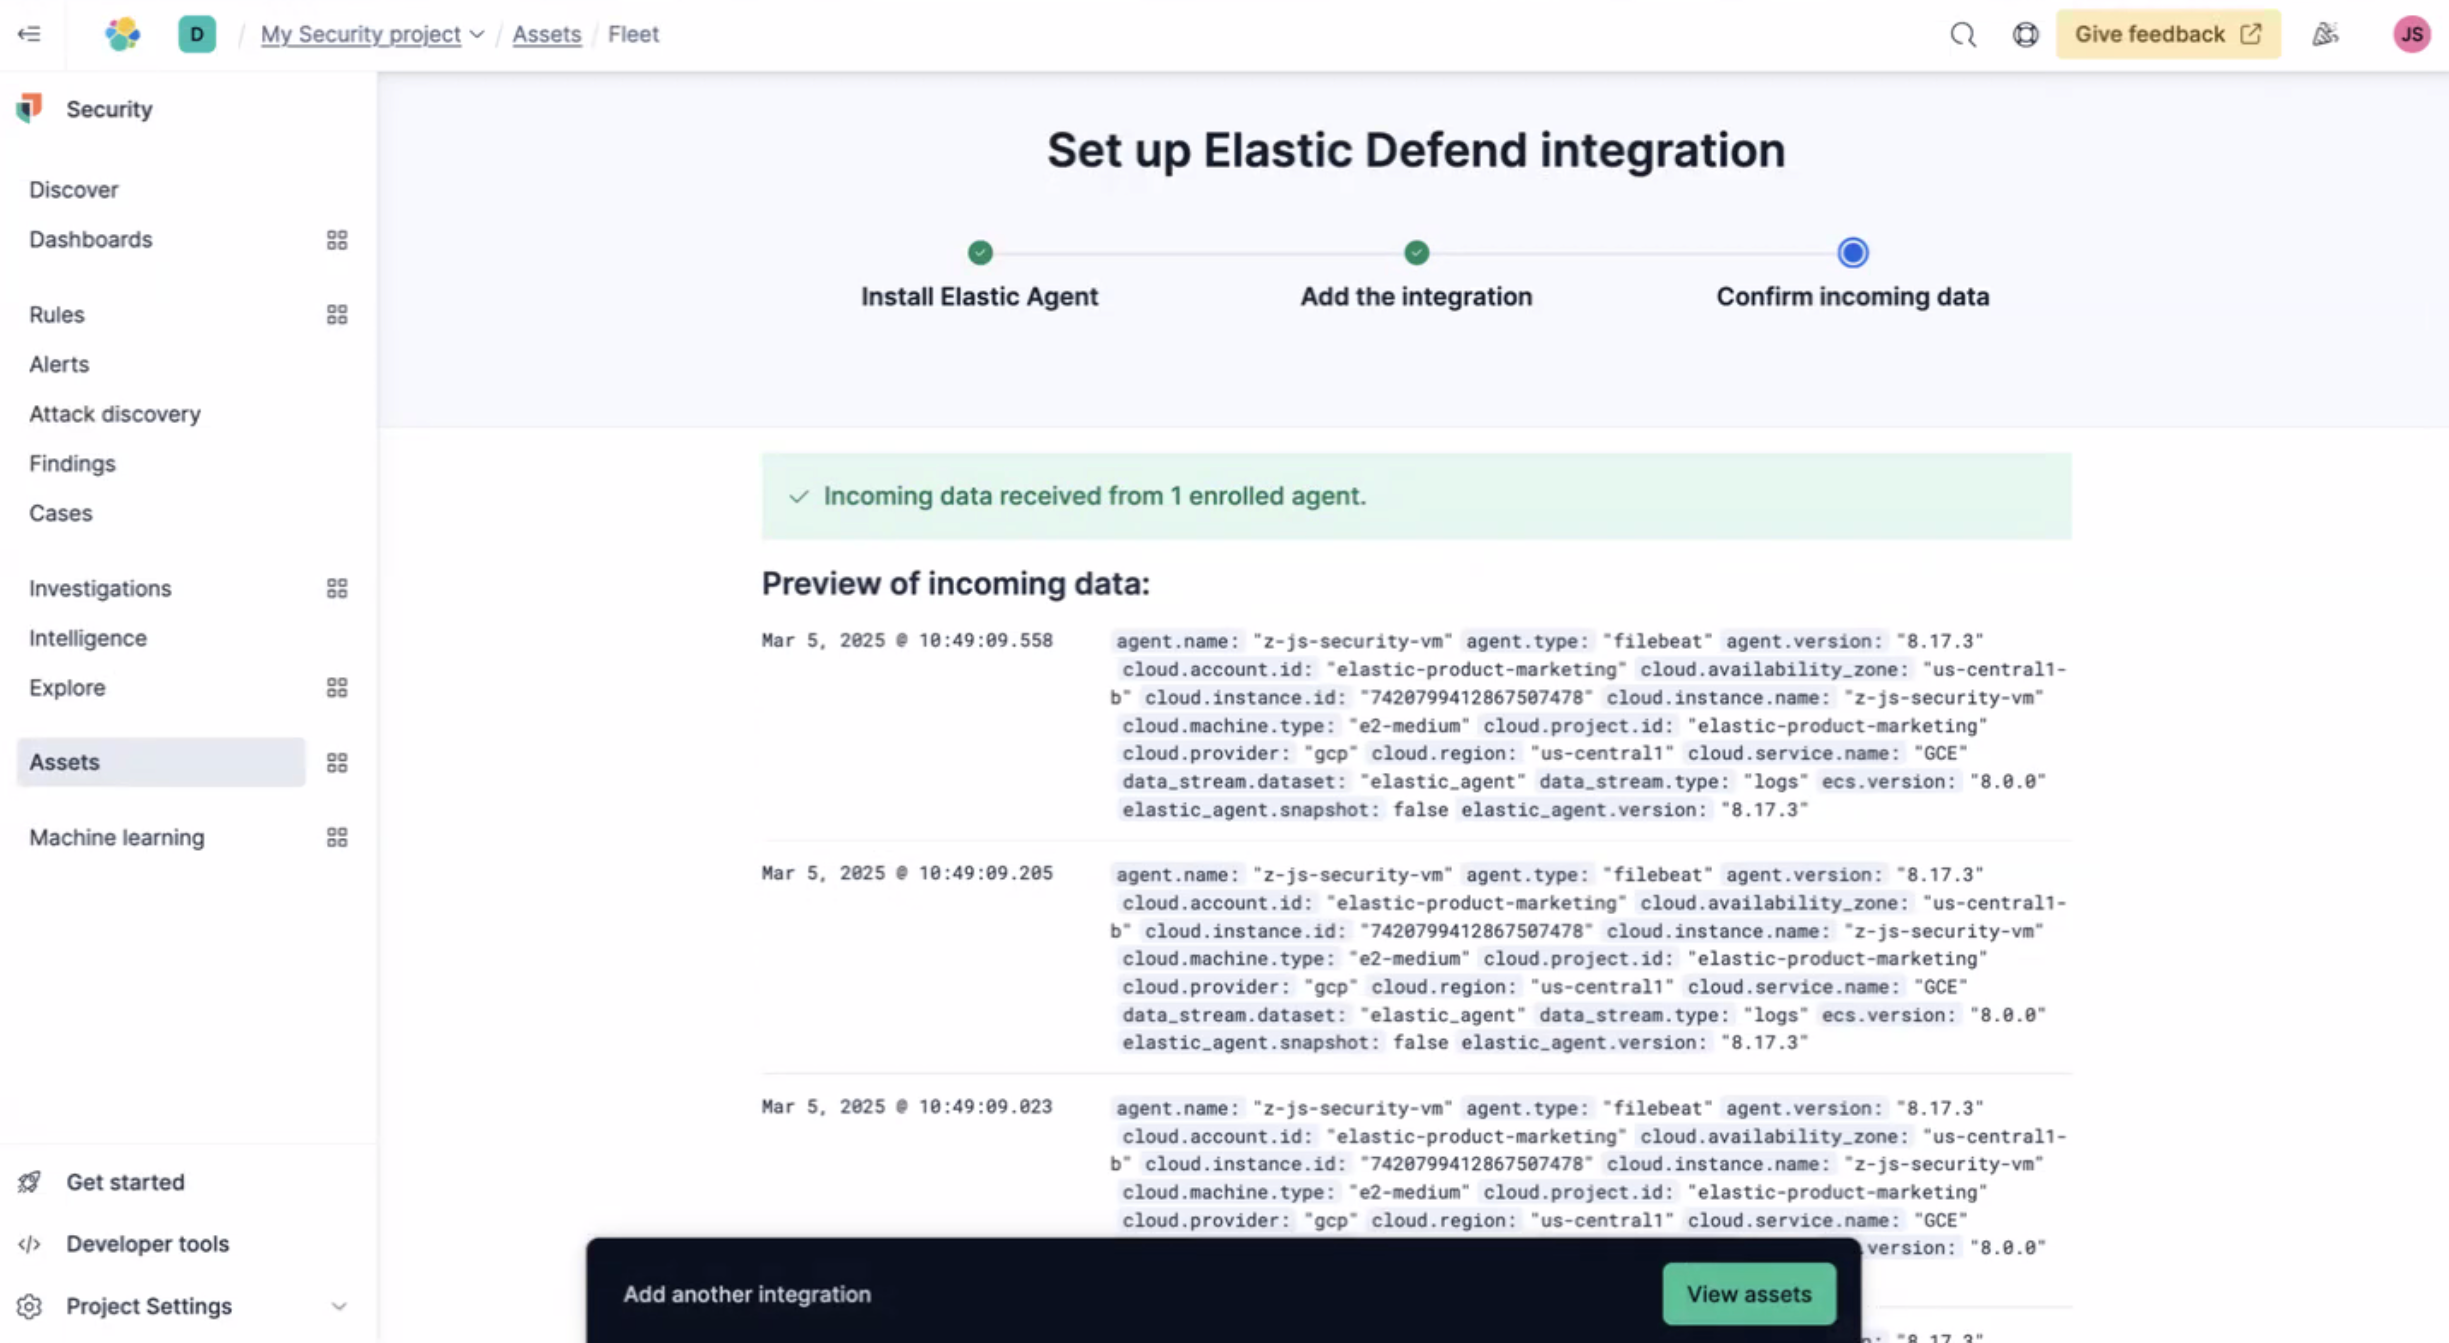
Once the Elastic Agent is installed you'll get confirmation Agent enrollment confirmed. Next, select Add the integration. And then Confirm incoming data.
Now you'll see that data is being received from the agent.
Working with Elastic Security
View and analyze your data using dashboards
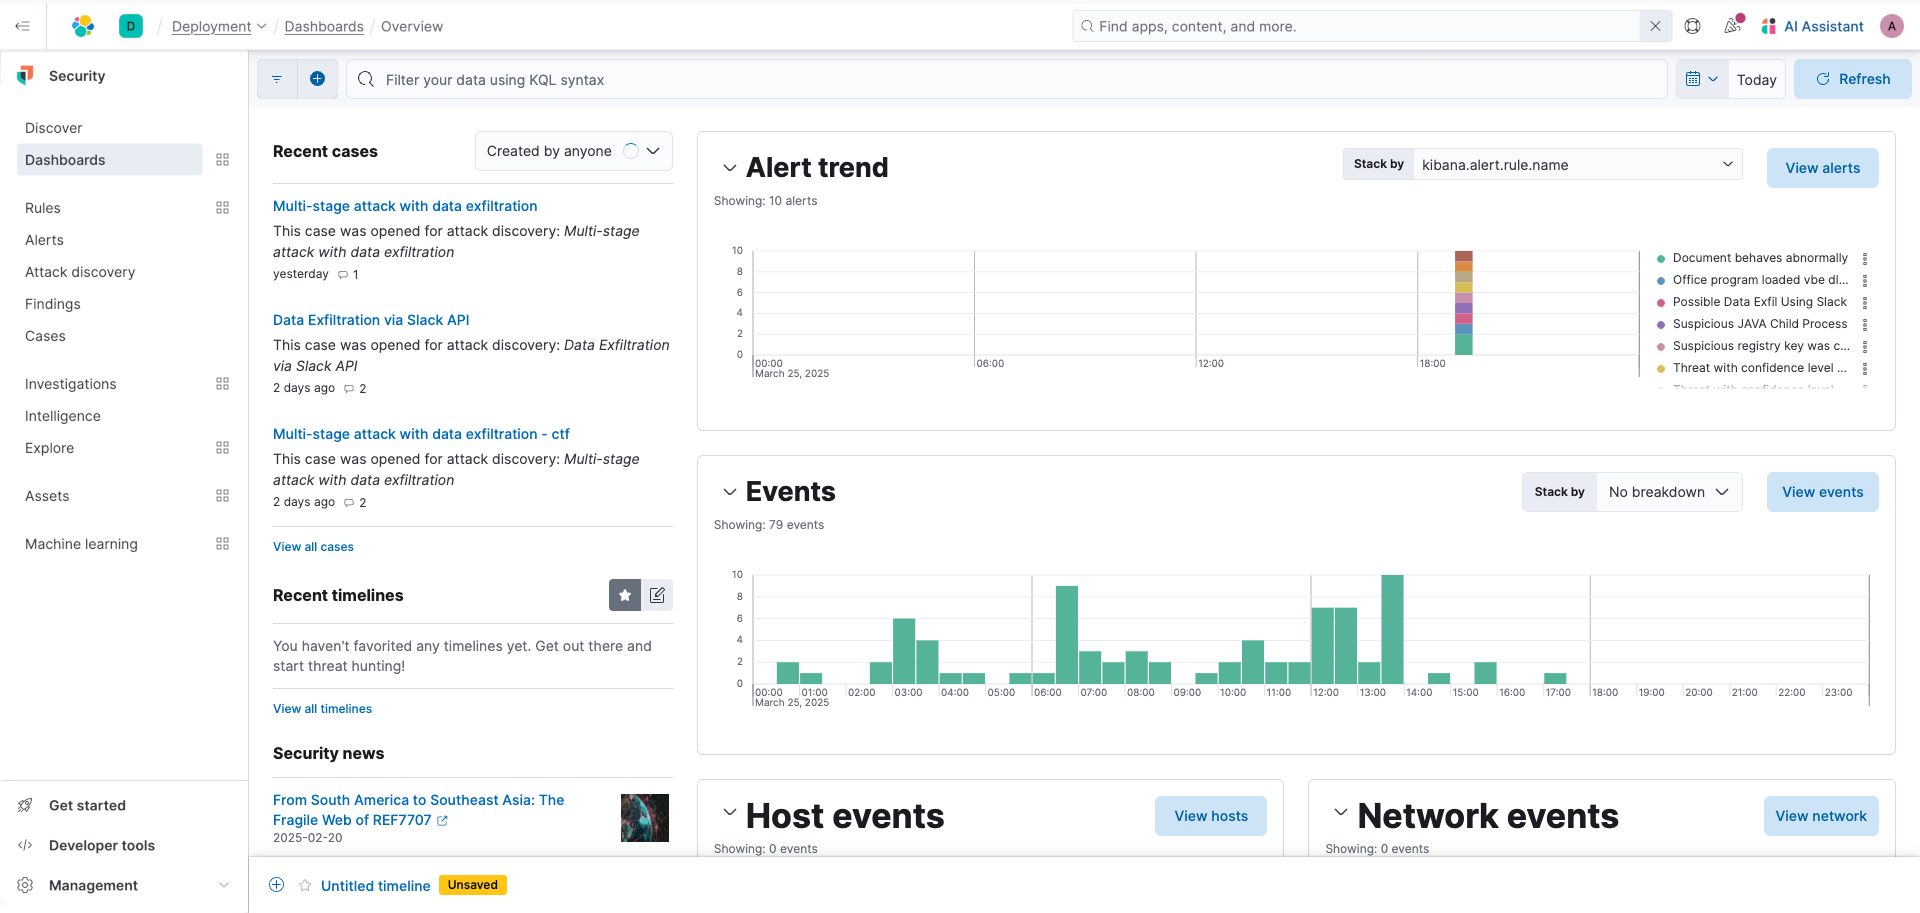
Now, let's start exploring what's happening in your environment, simply click Get started in the lower left navigation and then select View and analyze your data using dashboards then Use Elastic's default dashboards. Here you'll be presented with several out of the box dashboards you can leverage to explore your data.
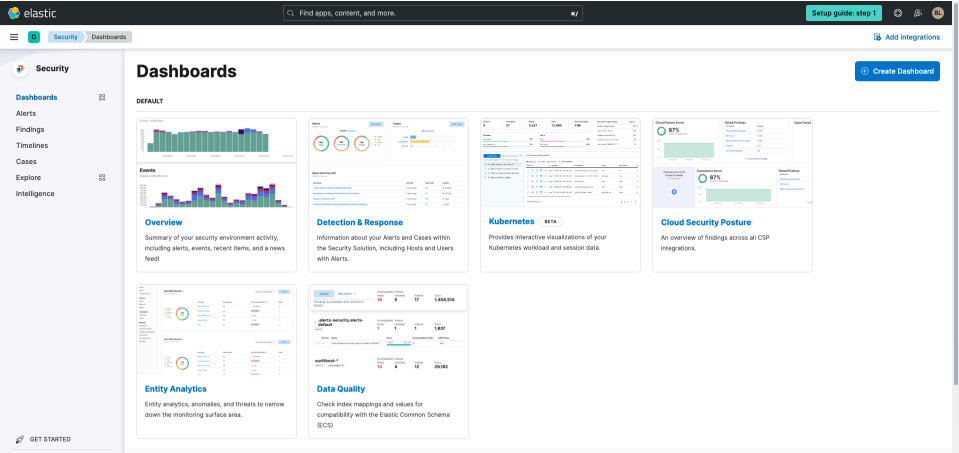
Select the Overview dashboard to start exploring data that's coming into Elastic Security.
Configure rules and alerts
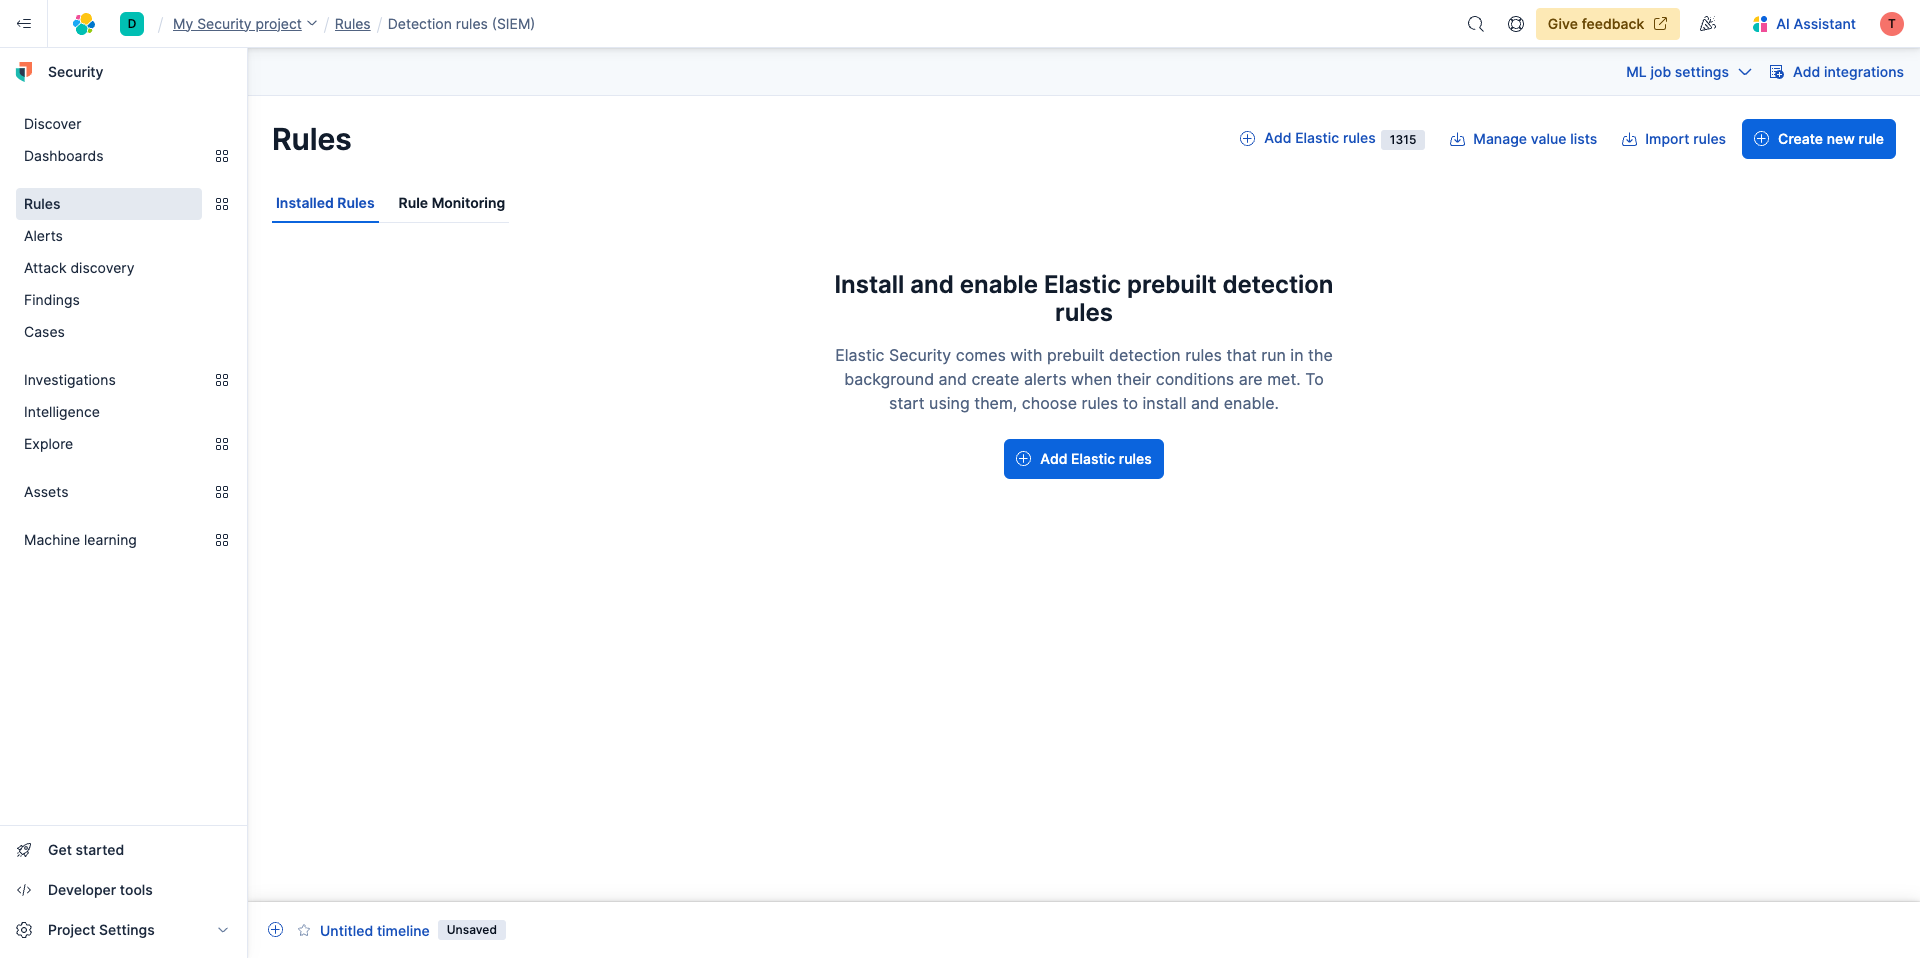
Rules allow you to proactively monitor your environment. To get started with enabling rules, navigate to Get Started in the lower left navigation panel and select Install Elastic rules and then Add Elastic rules.
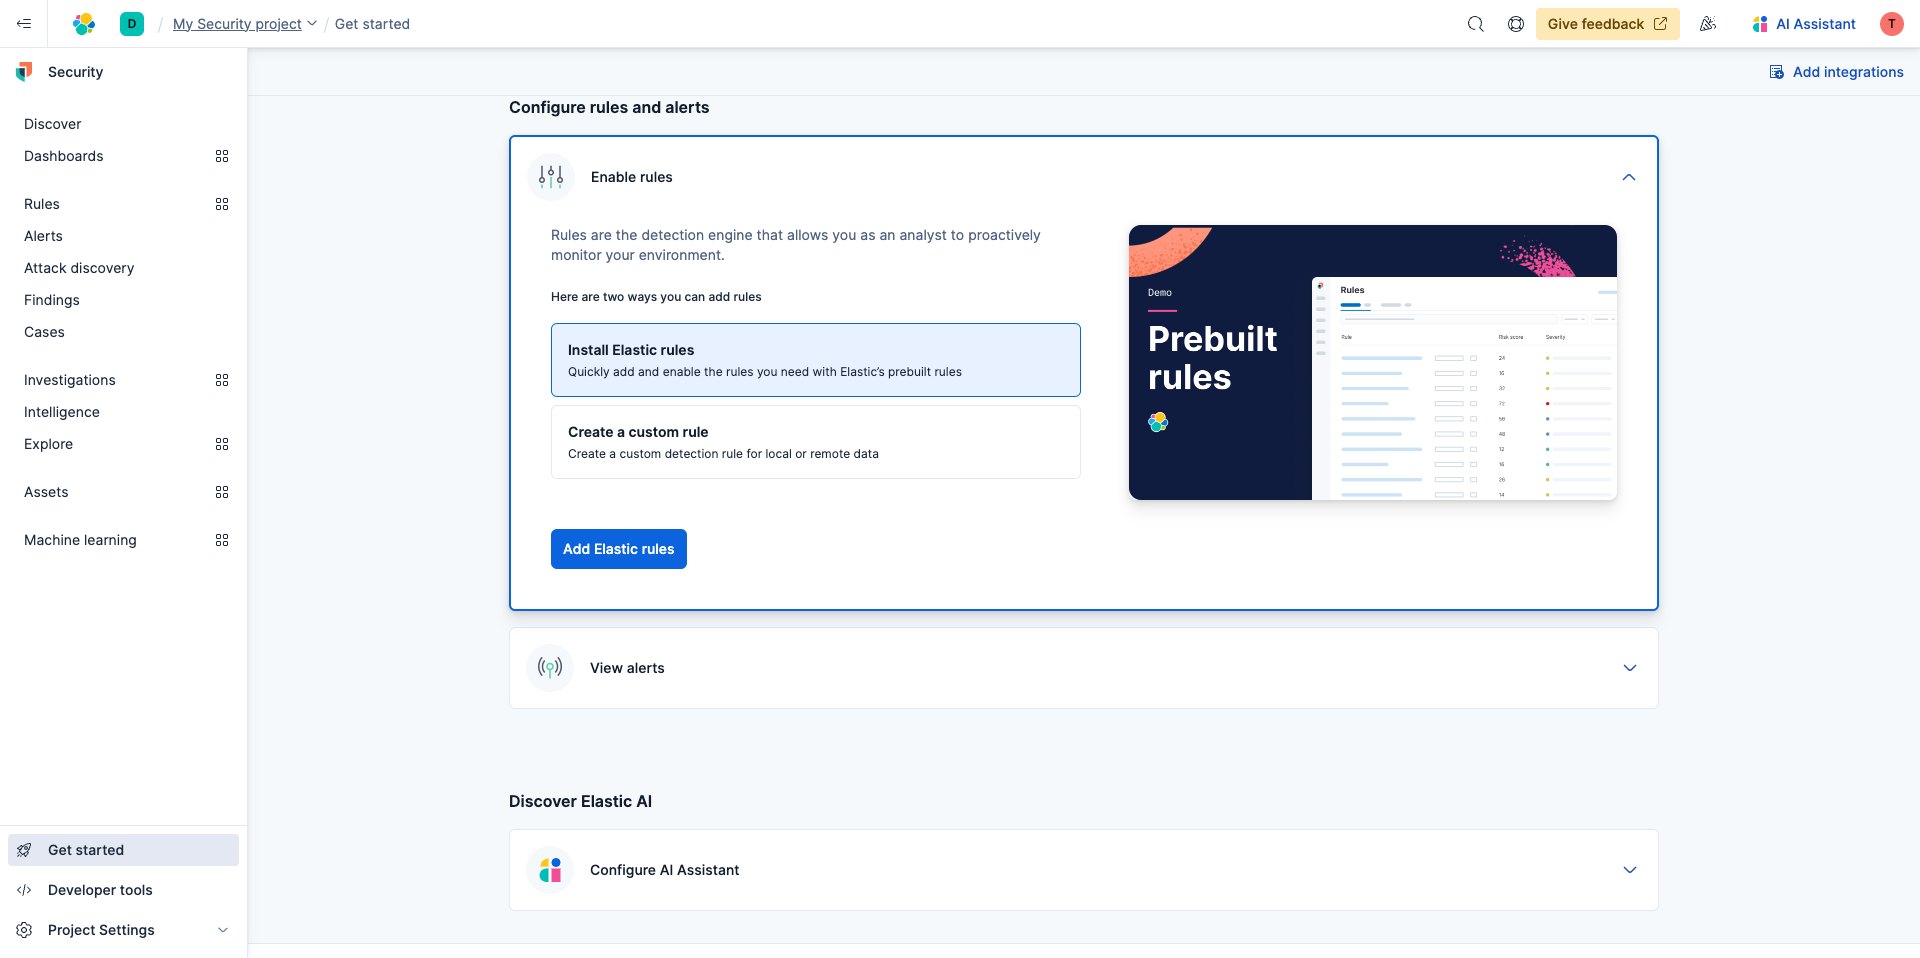
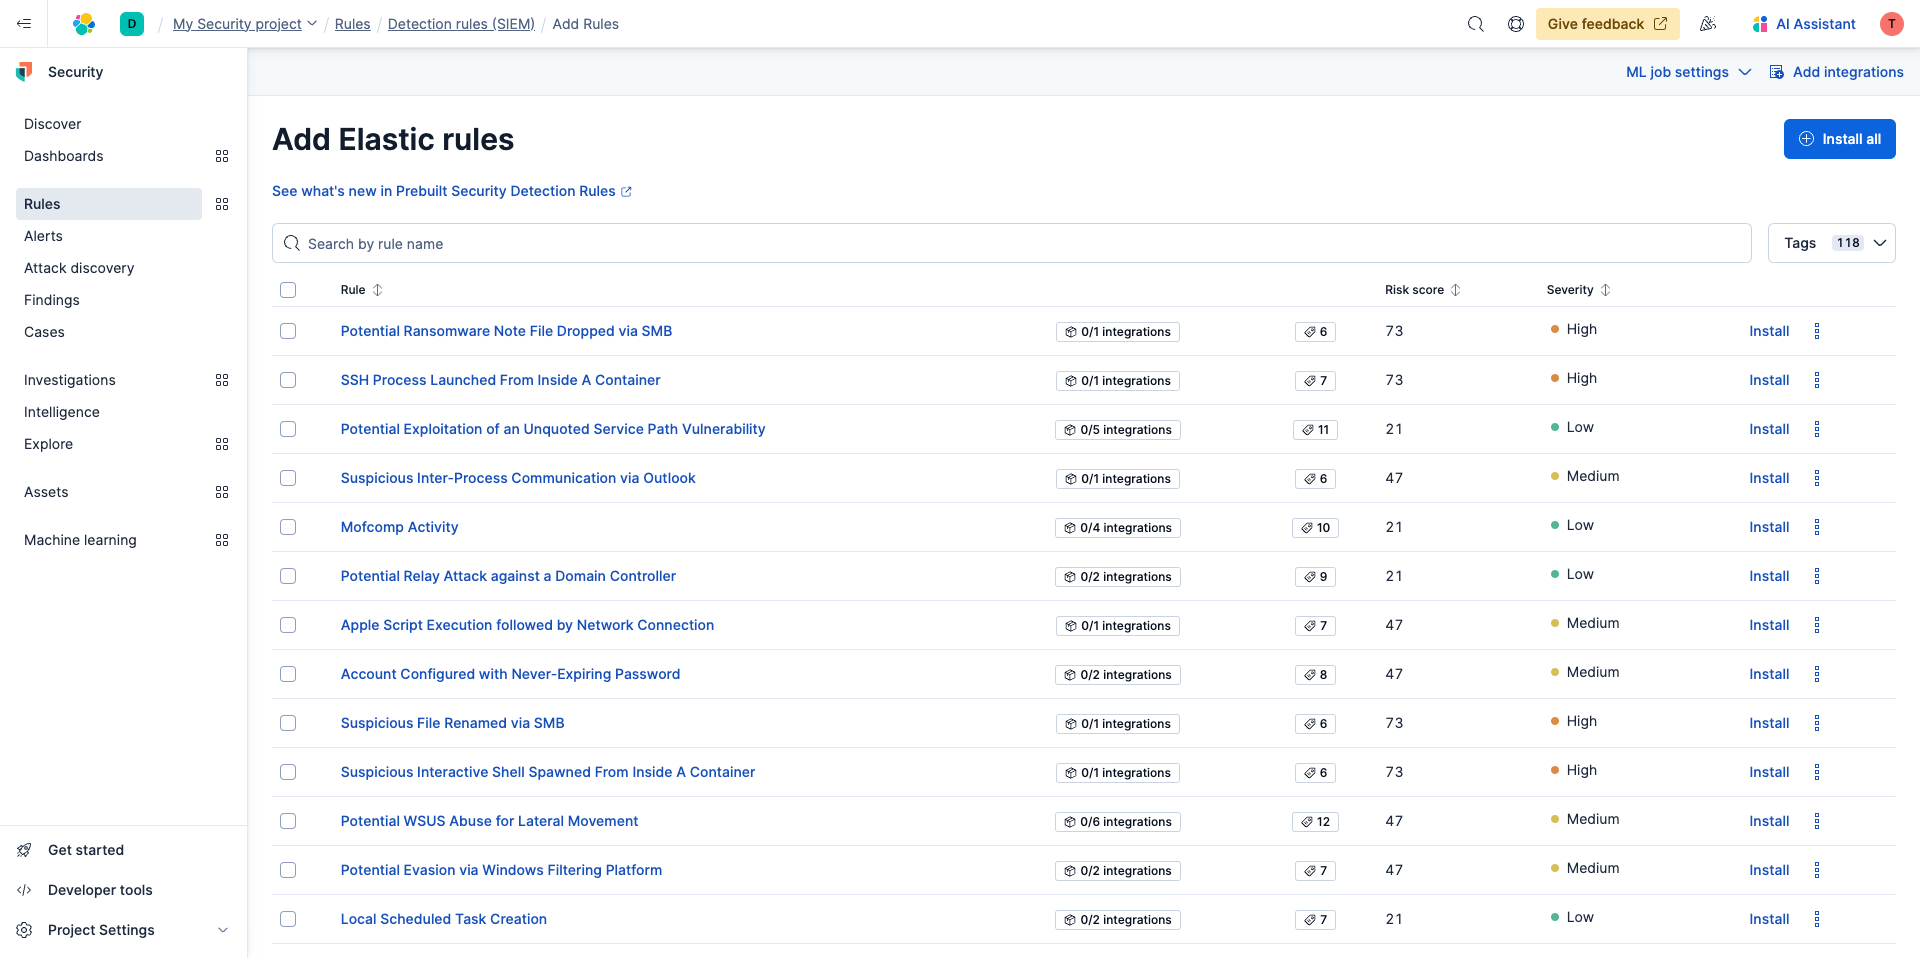
Elastic comes with prebuilt detect rules and alerts are created based on their conditions. Simply select Add Elastic rules then select Install all.
Use the search and tags to find specific rules you're looking for but for the purpose of this guide just install them all.
Now it's time to view your alerts. You would hope you don't have any. But in the event you do, here are the different views you can leverage to dig deeper.
Navigate back to Get Started in the left navigation and then select View alerts. The list below are the types of dashboards available to you so you can visualize, sort, filter, and investigate alerts from across your infrastructure.
- Alert list and details
- Investigate in Timeline
- Investigate in Analyzer
- Investigate in Session View
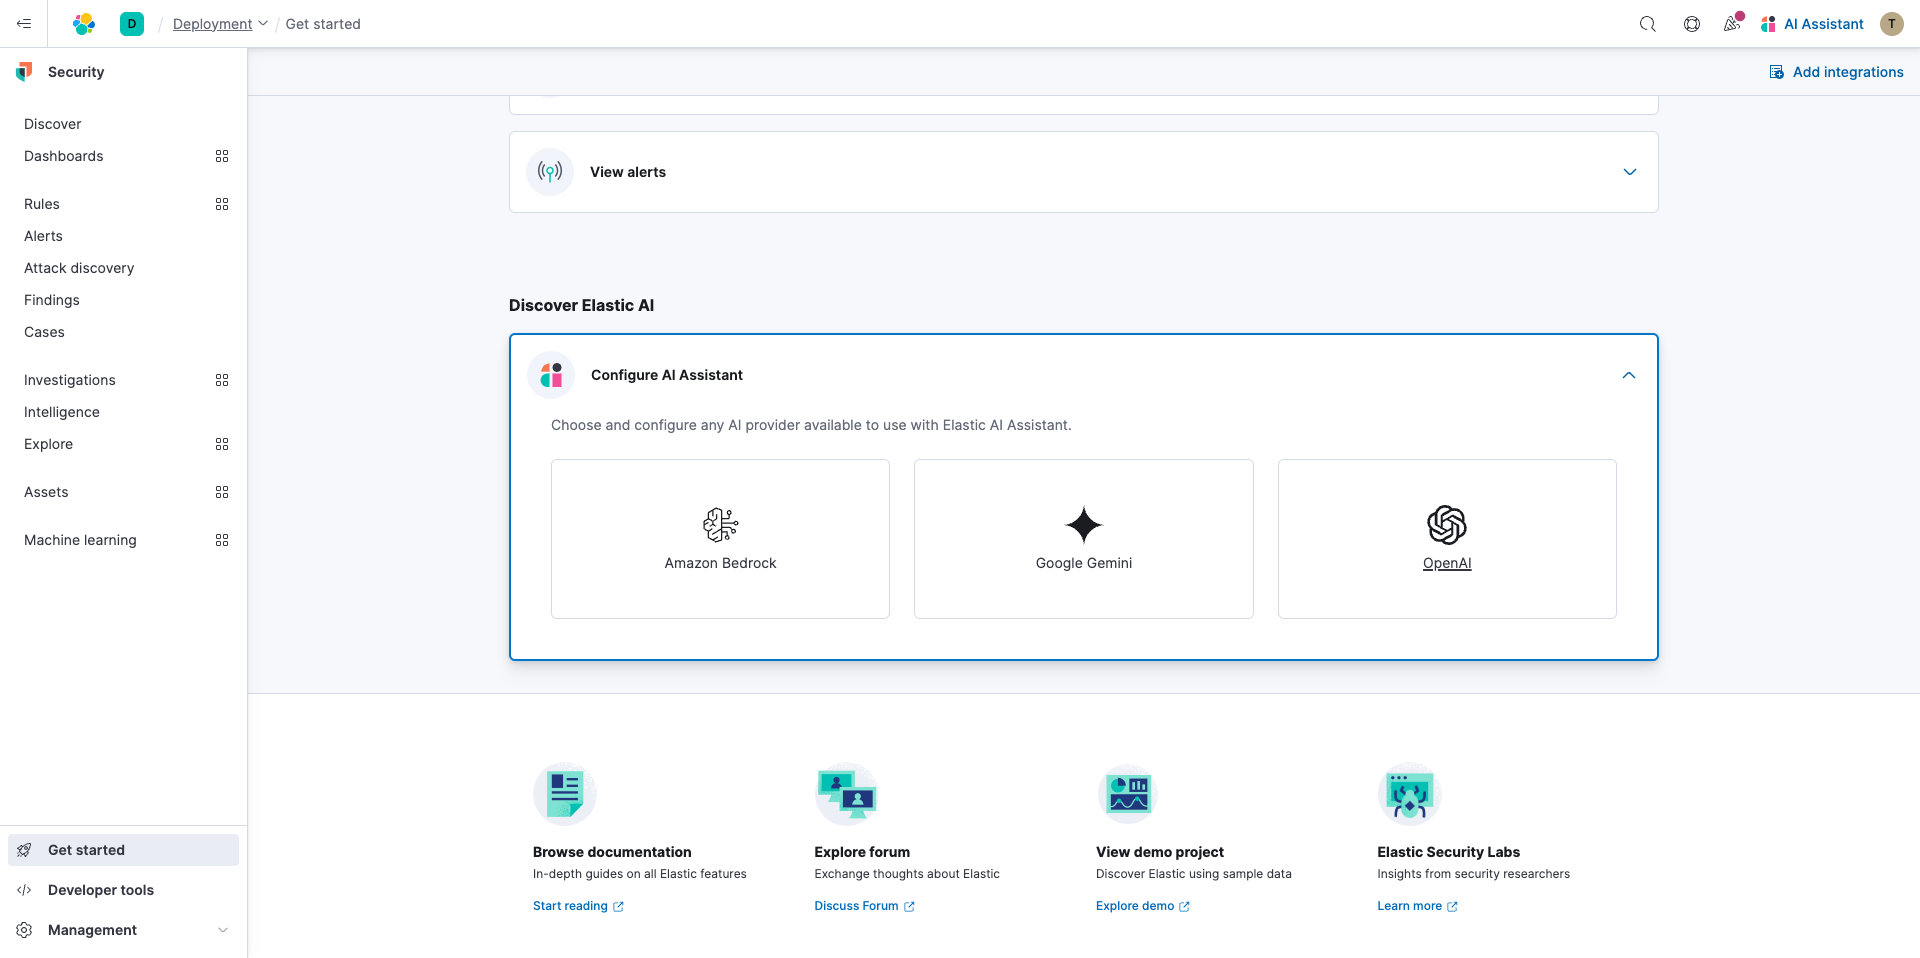
Discover Elastic AI
Now it's time to configure the AI Assistant. Simply choose your preferred set up guide from the following documentation.
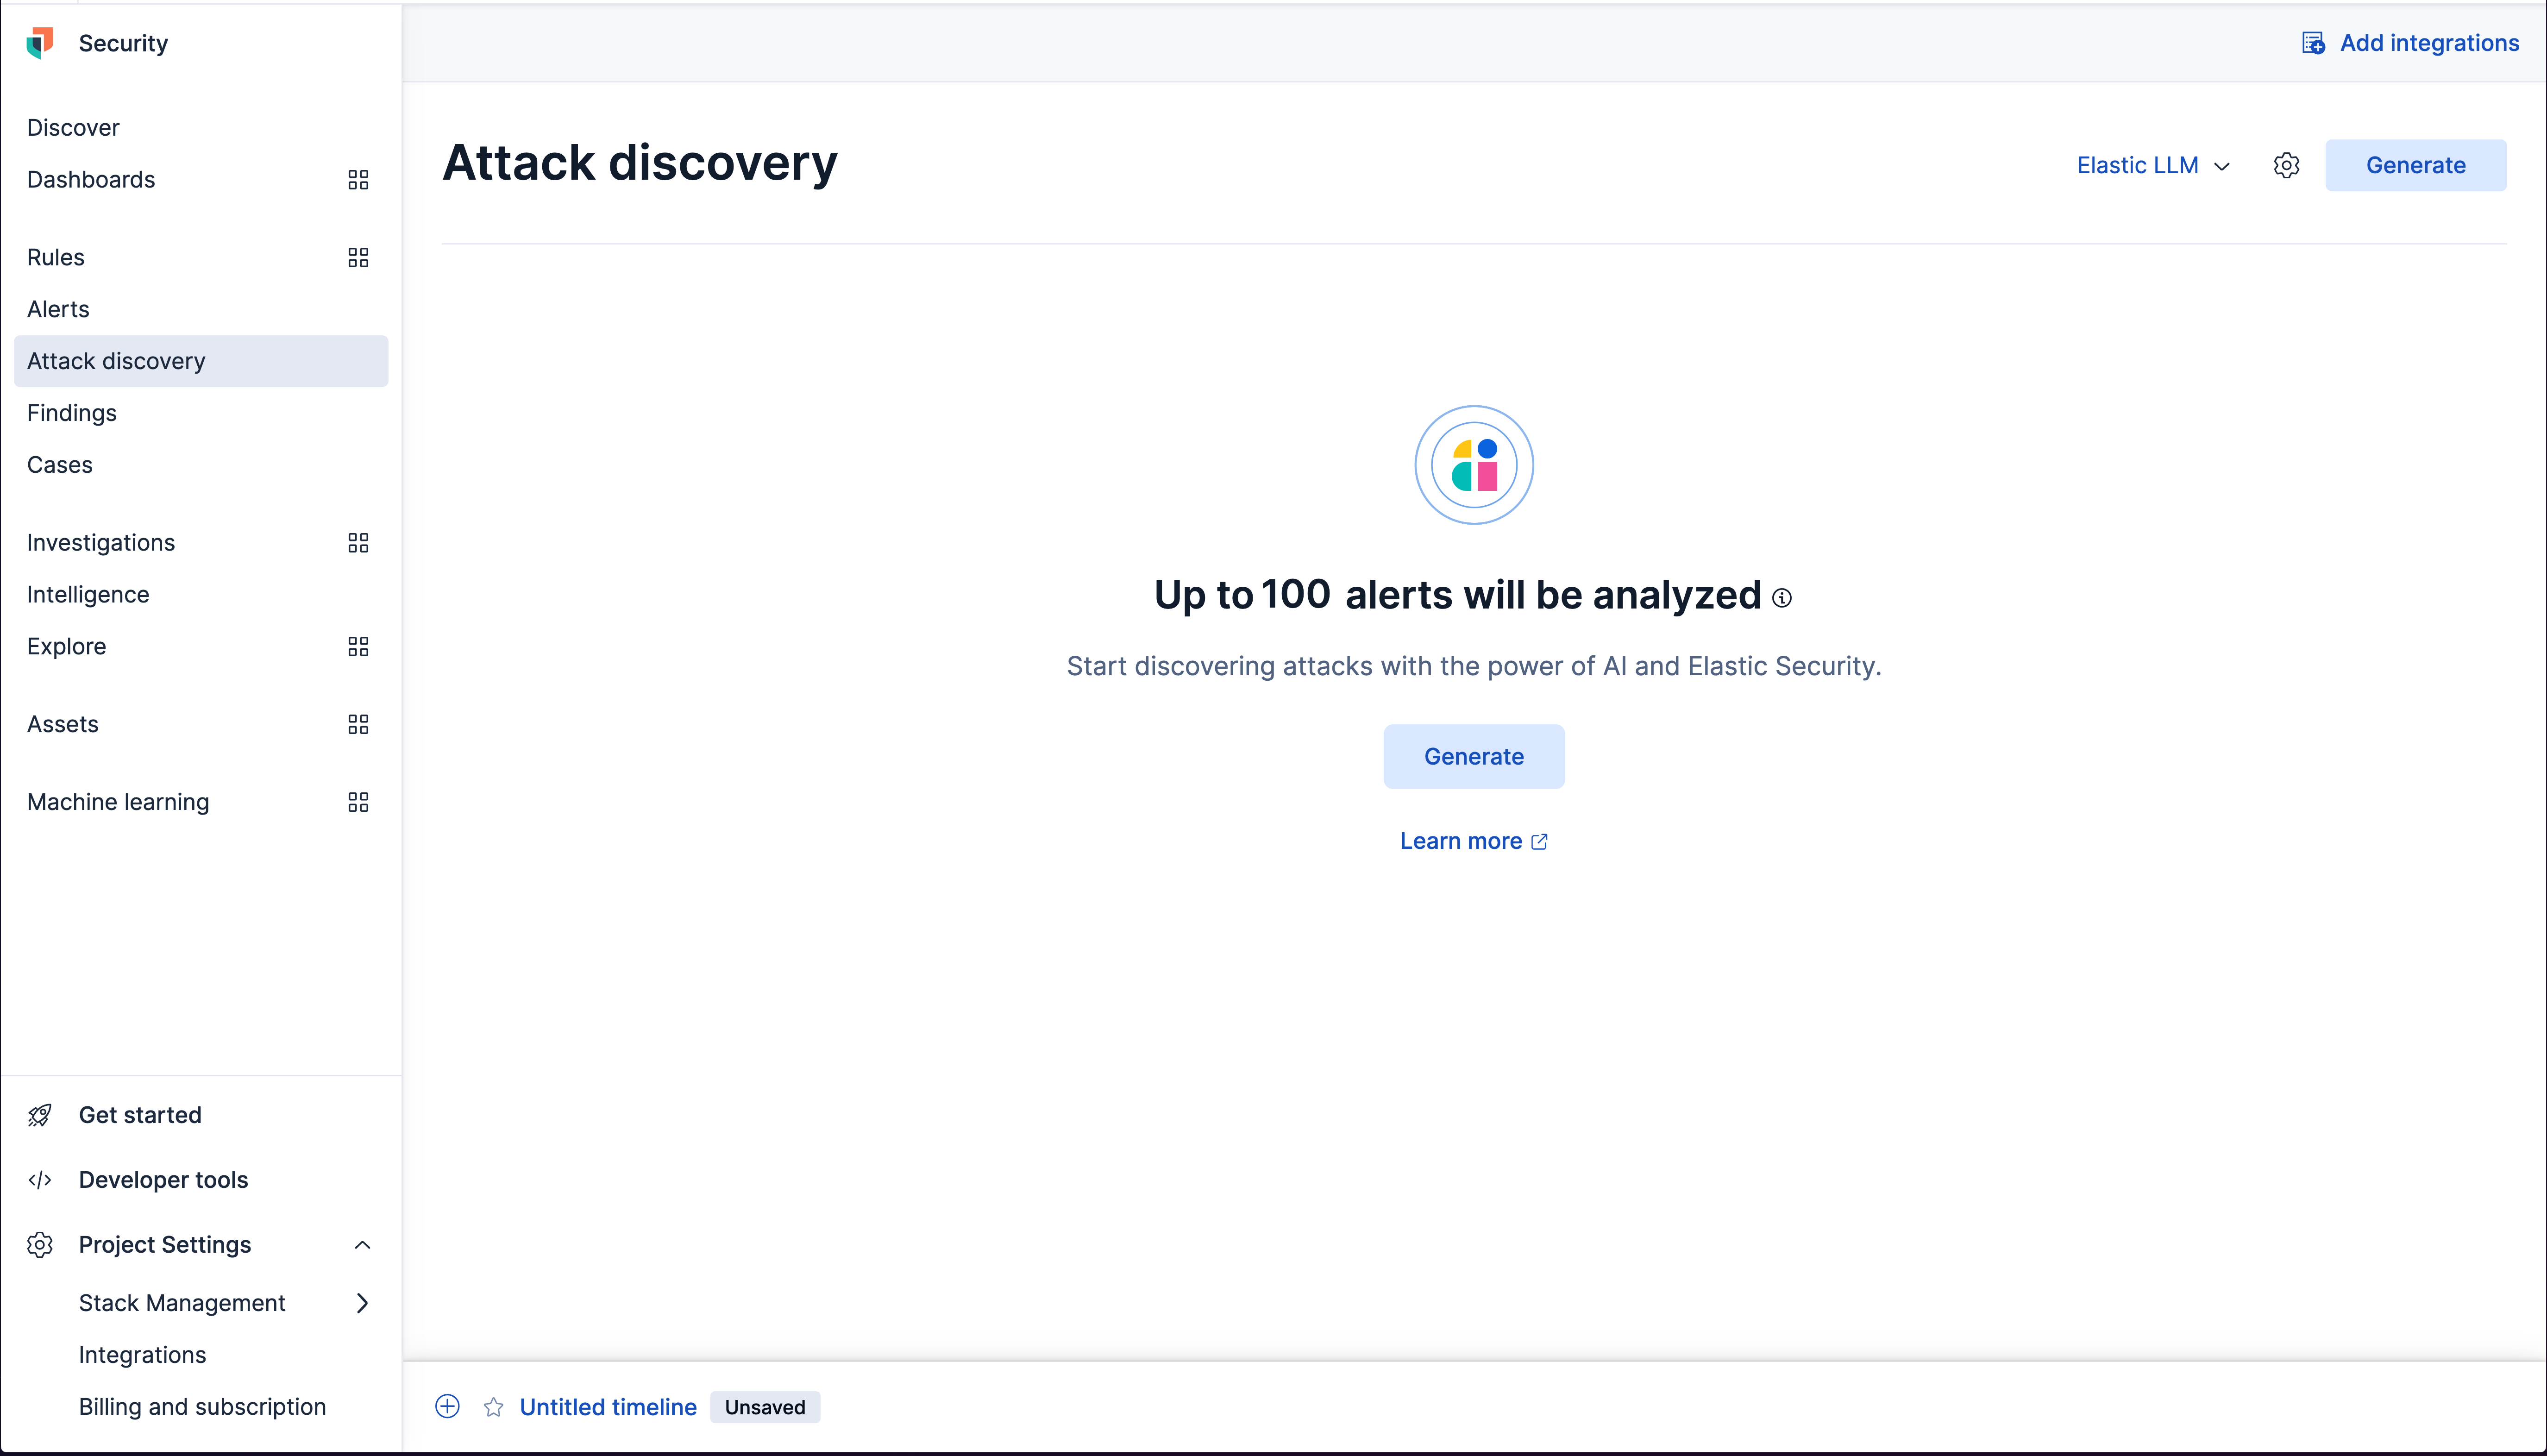
Get started with Attack Discovery
With the Elastic Search AI platform you can address many threats with search capabilities. Keep in mind, as your Elastic Security experience continues you may find you have multiple alerts to investigate and triage. Attack Discovery leverages large language models (LLMs) to analyze alerts in your environment and identify threats at scale.
If you navigate to Attack Discovery you'll see the large language models (LLM) that you connected prior have been selected in the upper right as well as a Generate button.
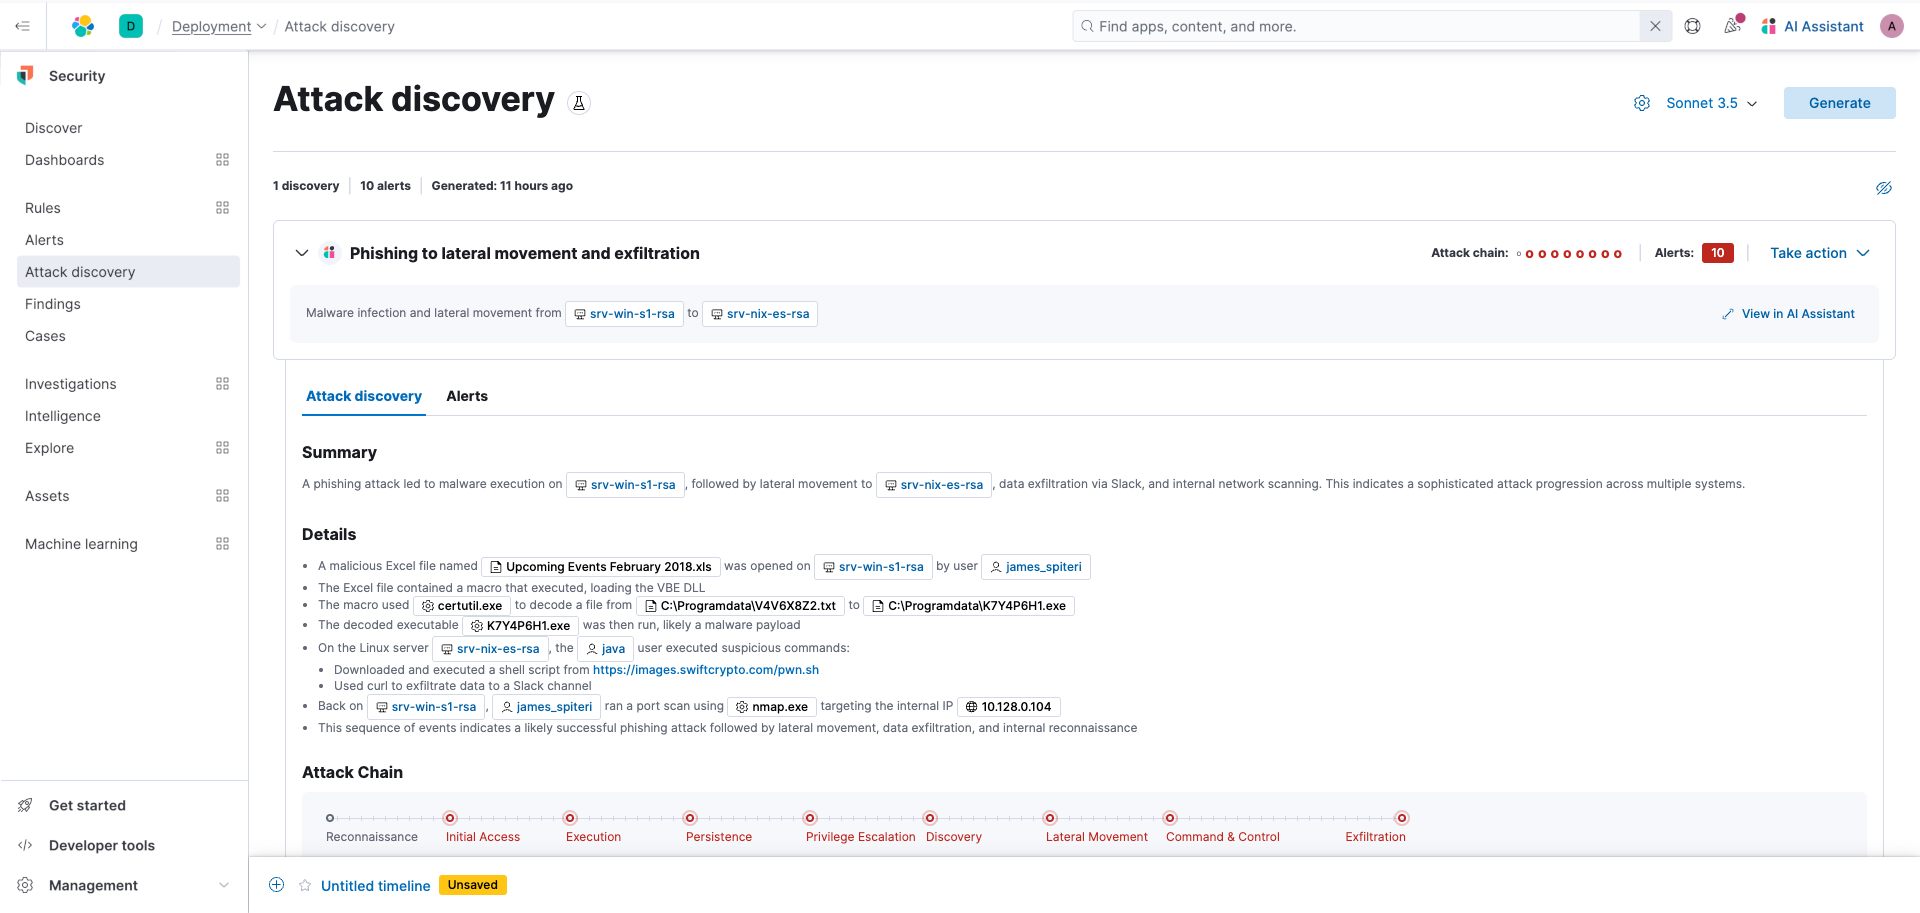
Next, you'll see a screen that lists all of the discoveries. Each "discovery" represents a potential attack and describes relationships among multiple alerts to tell you which users and hosts are involved, how alerts correspond to the MITRE ATT&CK matrix, and which threat actor might be responsible. This can help make the most of each security analyst's time, fight alert fatigue, and reduce your mean time to respond.
For more details and a video check out this documentation or follow the steps below:
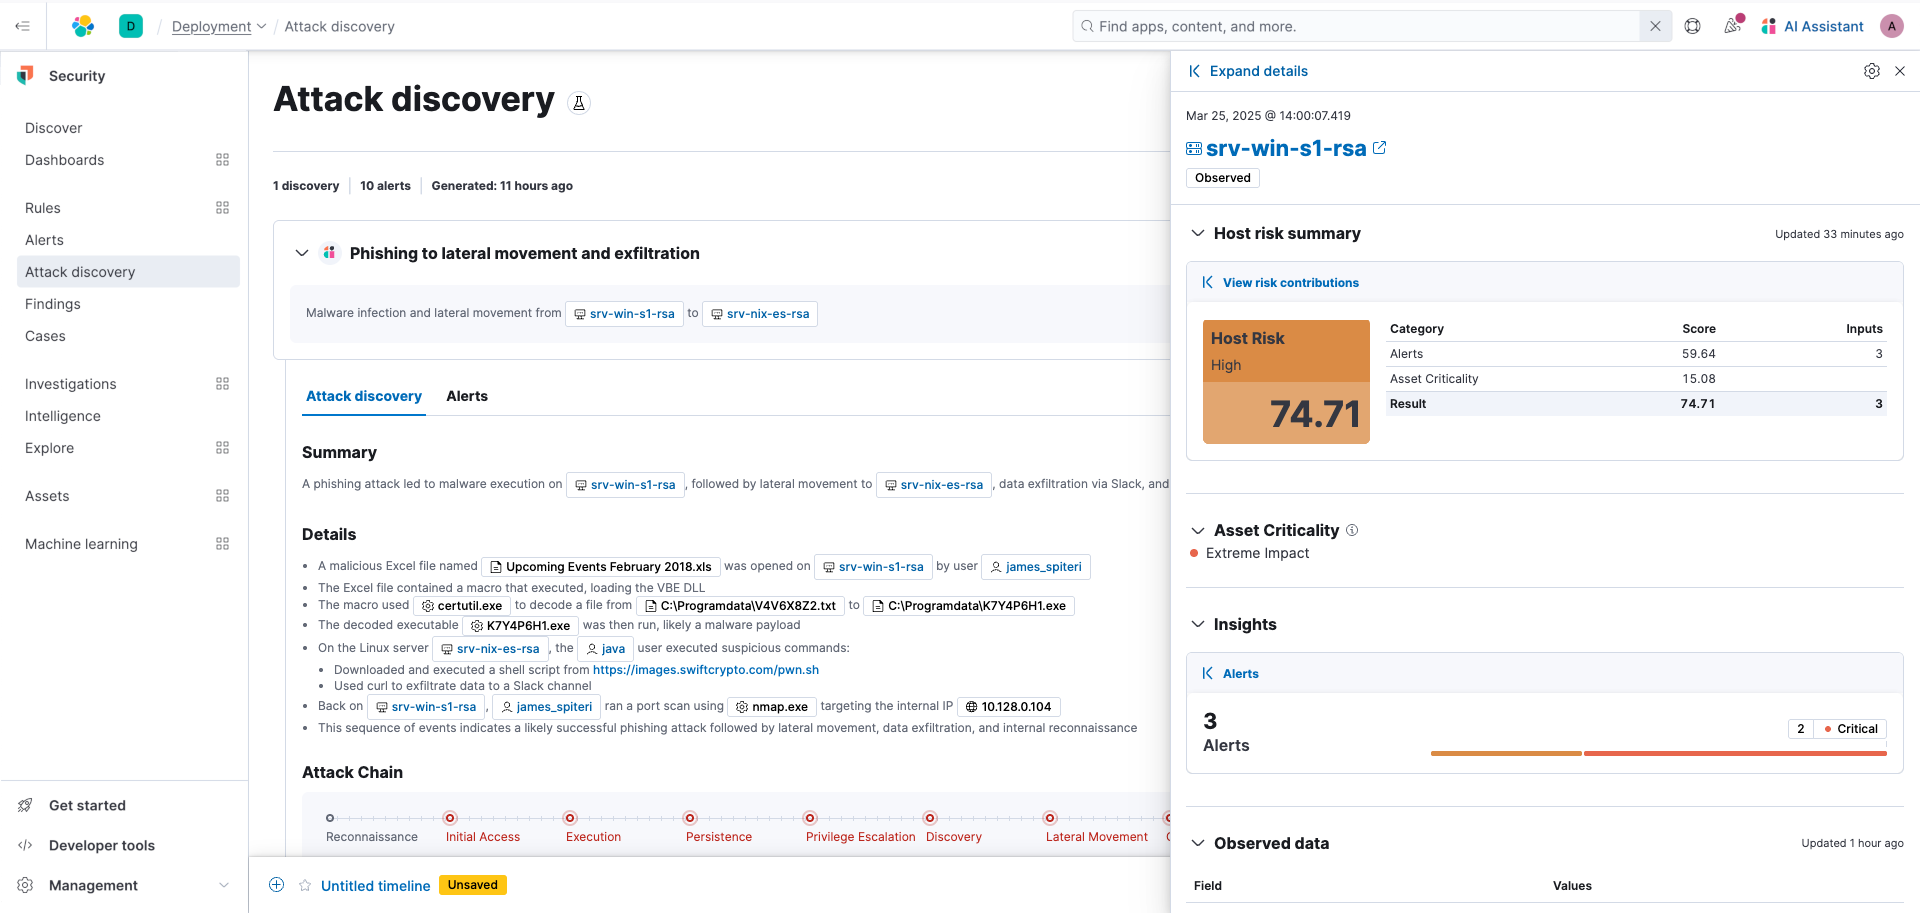
If you select the hosts, a flyout will open where you can view more details and invoke endpoint response actions.
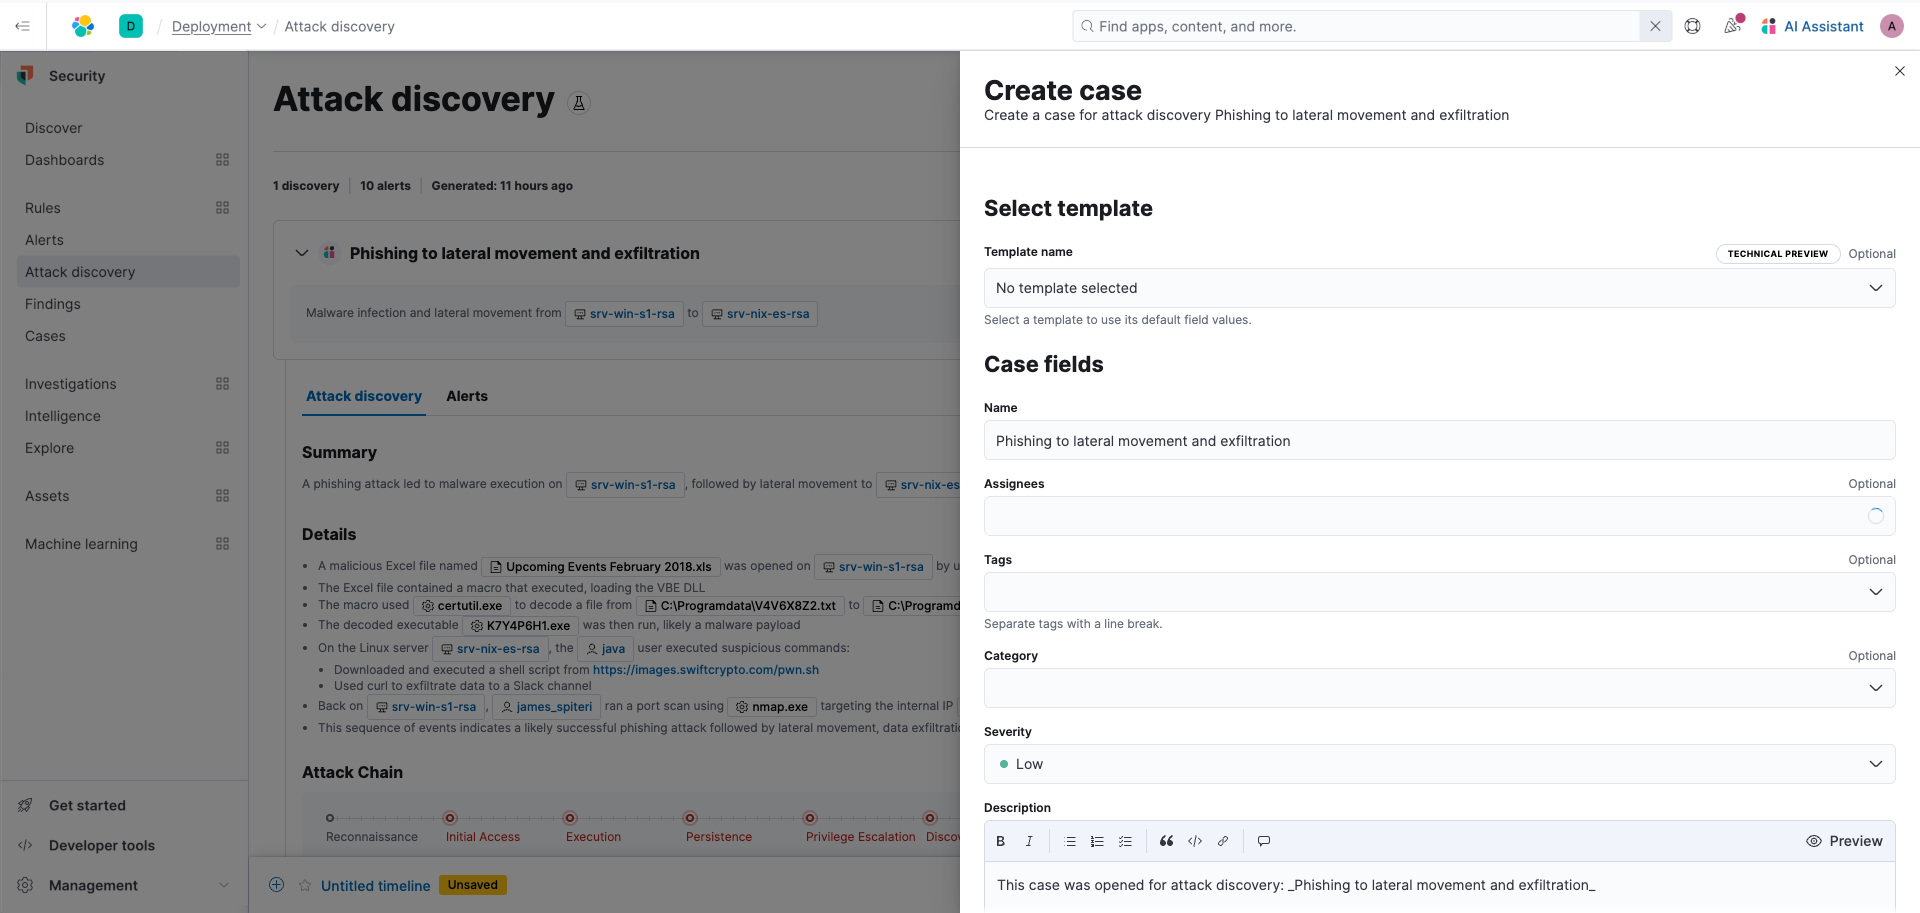
If you minimize the flyout then in the upper right corner select Take action then click Add to new case.
When you create a case, it’ll include all your data and alerts for each finding. This allowed you to continue the investigation and share among your team to easily collaborate as you dive in further.
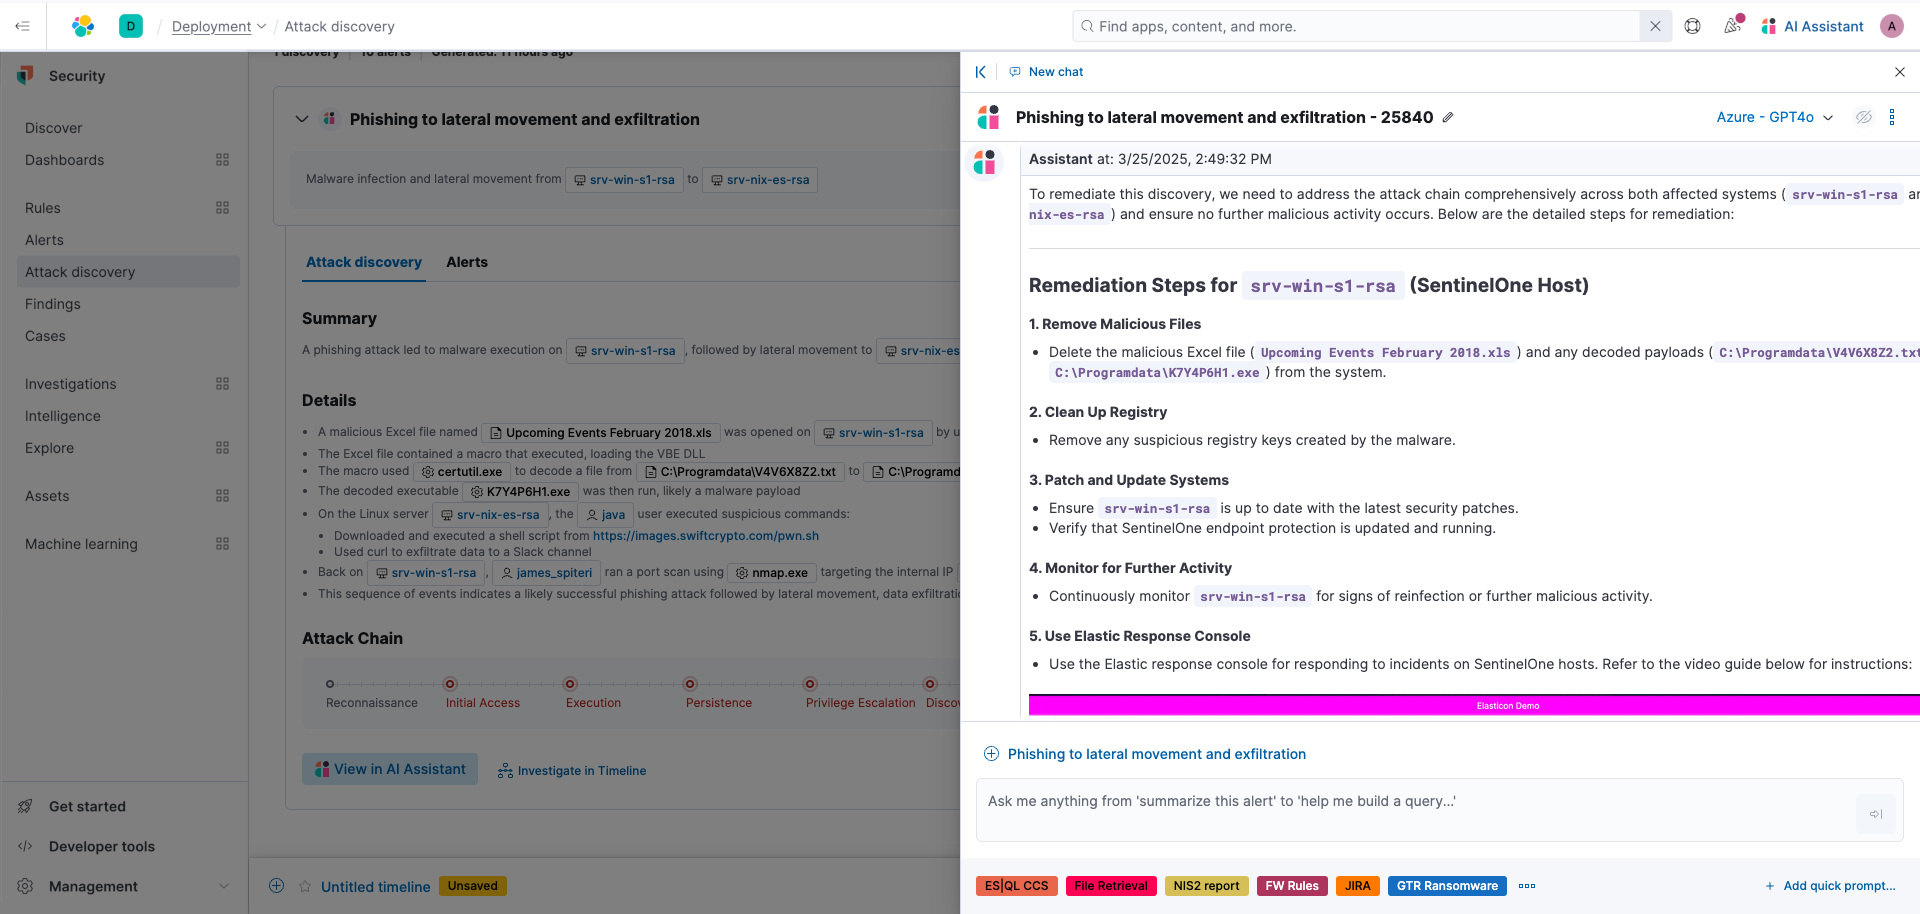
Similarly, you can leverage the AI Assistant and ask questions about this discovery.
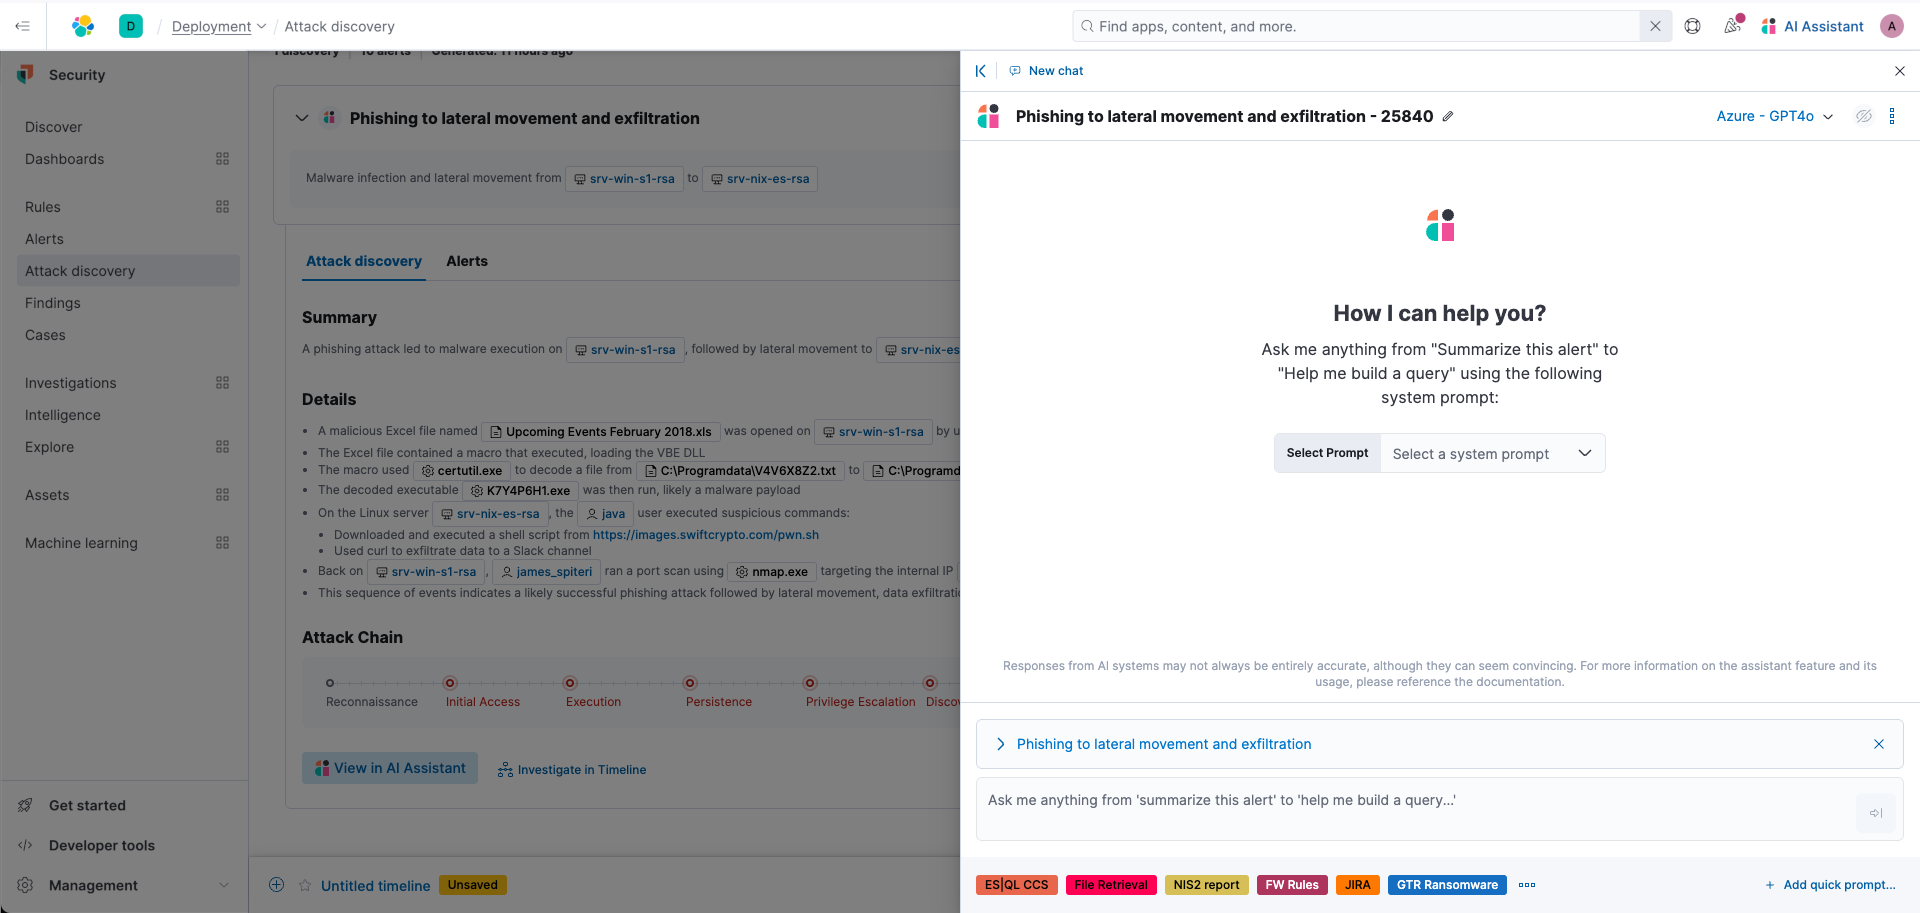
Let's ask, "How do we remedy this discovery?" You'll see that it returns steps on how to remediate the threat.
Next steps
Thanks for taking the time to get started with SIEM and Security Analytics As you begin your journey with Elastic, be sure to understand some operational, security, and data components you should manage as a user when you deploy across your environment.
Ready to get started? Spin up a free 14-day trial on Elastic Cloud or try out these 15-minute hands-on learnings on Security 101.