There are a number of ways that hotspotting can occur in an Elasticsearch cluster. Some we can control, like noisy neighbors, and some we have less control over, like the shard allocation algorithm in Elasticsearch. The good news is that the new desired_balance cluster.routing.allocation.type algorithm (see shards-rebalancing-heuristics) is much better at determining which nodes in the cluster should get the new shards. If there is an imbalance present, it will figure out the optimal balance for us. The bad news is that older Elasticsearch clusters are still using the balanced allocation algorithm which has a more limited calculation that is prone to making mistakes when choosing nodes that can lead to imbalanced or hotspotted clusters.
In this blog we will explore this old algorithm, how it is supposed to work and when it does not work, and what we can do to address it. We will then go through the new algorithm and how it solves this problem, and finally we will look at how we used AutoOps to highlight this issue for a customer use case. We will however not go into all the causes for hotspotting, nor will we go into all the specific solutions as they are quite numerous.
Balanced allocation
In Elasticsearch 8.5 and earlier we used the following method to determine which node to place a shard, this method mostly came down to choosing the node with the least number of shards: https://github.com/elastic/elasticsearch/blob/8.5/server/src/main/java/org/elasticsearch/cluster/routing/allocation/allocator/BalancedShardsAllocator.java#L242
float weight(Balancer balancer, ModelNode node, String index) {
    final float weightShard = node.numShards() - balancer.avgShardsPerNode();
    final float weightIndex = node.numShards(index) - balancer.avgShardsPerNode(index);
    return theta0 * weightShard + theta1 * weightIndex;
}node.numShards(): the number of shards allocated to a specific node in the clusterbalancer.avgShardsPerNode(): the mean of the shards across all the nodes in the clusternode.numShards(index): the number of shards for a specific index allocated to a specific node in the clusterbalancer.avgShardsPerNode(index): the mean of the shards for a specific index across all the nodes in the clustertheta0:(cluster.routing.allocation.balance.shard) weight factor for the total number of shards, defaults to 0.45f, increasing this raises the tendency to equalise the number of shards per node, (see Shard balancing heuristics settings)theta1: (cluster.routing.allocation.balance.index) weight factor for the total number of shards per index, defaults to 0.55f, increasing this raises the tendency to equalise the number of shards per index per node, (see Shard balancing heuristics settings)
The target value for this algorithm across the cluster is to pick a node in such a way that the weight across all the nodes in the cluster gets us back to 0 or gets us the closest to 0.
Example
Let's explore a situation where we have 2 nodes with 1 index made up of 3 primary shards, and let's assume we have 1 shard on node 1 and 2 shards on node 2. What should happen when we add a new index to the cluster with 1 shard?
Since the new index has no shards anywhere else in the cluster, the weightIndex term reduces to 0, as we can see in the next calculation adding the shard to node 1 will bring the balance back to 0 so we choose node 1.
Now let's add another index with 2 shards, the first shard will go randomly to one of the nodes since we are now balanced. Assuming node 1 was chosen for the first shard, the second shard will go to node 2.
The new balance will finally be:
This algorithm will work well if all indices/shards in the cluster are doing approximately the same amount of work in terms of ingest, search and storage requirements. In reality, most Elasticsearch use cases are not this simple and the load across the shards is not always the same, imagine the following scenario.
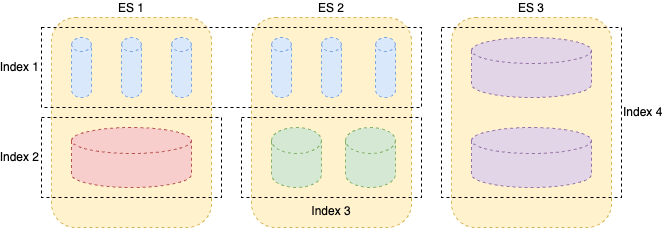
Image 1: Elasticsearch cluster (the exaggerated size of the shards represent how “busy” the shards actually are)
- Index 1, small search use case with a few thousand documents, incorrect number of shards,
- Index 2, very large index, but not being actively written to and occasional searching,
- Index 3, light indexing and searching,
- Index 4, heavy ingest application logs.
Let’s suppose, we have 3 nodes and 4 indices with only primary shards, deliberately in an unbalanced state. To visually understand what is going on I have exaggerated the size of the shards according to how busy they are and what busy could mean (write, read, cpu, ram or storage). Even though node 3 already has the busiest index, new shards will route to that node. Index lifecycle management (ILM) won’t solve this situation for us, when the index is rolled over, the new shards will be placed on node 3. We could manually ease this problem by forcing Elasticsearch to spread the shards evenly using cluster reroute, but this does not scale, as our distributed system should take care of this. Still, without any rebalance or other kinds of intervention, this situation will remain and potentially get worse. What’s more, while this example is fake, this kind of distribution is inevitable in older Elasticsearch clusters with mixed use cases (i.e., search, logging, security) especially when one or more of the use cases is heavy ingest, determining when this will occur is not trivial.
While the timeframe to predict this issue is complicated, a good solution that works well in some use cases is to keep the shard density across all indices the same, this is achieved by rolling all indices when their shards get to a predetermined size in Gigabytes, (see size your shards). This does not work in all use cases, as we will see in the cluster caught by AutoOps below.
Desired balance allocation
To address this issue and a few others, a new algorithm that can take into account both write load and disk usage was initially released in 8.6 and underwent some minor, yet meaningful, changes in versions 8.7 and 8.8: https://github.com/elastic/elasticsearch/blob/8.8/server/src/main/java/org/elasticsearch/cluster/routing/allocation/allocator/BalancedShardsAllocator.java#L305
float weight(Balancer balancer, ModelNode node, String index) {
    final float weightShard = node.numShards() - balancer.avgShardsPerNode();
    final float weightIndex = node.numShards(index) - balancer.avgShardsPerNode(index);
    final float ingestLoad = (float) (node.writeLoad() - balancer.avgWriteLoadPerNode());
    final float diskUsage = (float) (node.diskUsageInBytes() - balancer.avgDiskUsageInBytesPerNode());
    return theta0 * weightShard + theta1 * weightIndex + theta2 * ingestLoad + theta3 * diskUsage;
}node.writeLoad(): the write or indexing load of a specific nodebalancer.avgWriteLoadPerNode(): the mean write load across the clusternode.diskUsageInBytes(): the disk usage for a specific nodebalancer.avgDiskUsageInBytesPerNode(): the mean disk usage across the clustertheta2: (cluster.routing.allocation.balance.write_load) weight factor for the write load, defaults to 10.0f, increasing this raises the tendency to equalise the write load per node, (see Shard balancing heuristics settings)theta3: (cluster.routing.allocation.balance.disk_usage) weight factor for the disk usage, defaults to 2e-11f, increasing this raises the tendency to equalise the disk usage per node, (see Shard balancing heuristics settings)
I will not go into detail in this blog on the calculations that this algorithm is doing, however the data that is used by Elasticsearch to decide where the shards should live is available via an API: Get desired balance. It is still a best practice to follow our guidance when you size your shards and there are still good reasons to separate out use cases into dedicated Elasticsearch clusters. Yet this algorithm is much better at balancing Elasticsearch, so much so that it resolved the balancing issues for our customer below. (If you are facing the issue described in this blog, I recommend that you upgrade to 8.8).
One final thing to note, this algorithm does not take into account search load, this is not trivial to measure and even harder to predict. Adaptive replica selection, introduced in 6.1, goes a long way to addressing search load. In a future blog we will dive deeper into the topic of search performance and specifically how we can use AutoOps to catch our search performance issues before they occur.
Detecting hotspotting in AutoOps
Not only is the situation described above difficult to predict, but when it occurs it used to be difficult to detect, it takes a lot of internal understanding of Elasticsearch and very specific conditions for our clusters to end up in this state.
Now with AutoOps detecting this issue is a cinch. Let’s see a real world example;
In this setup there is a queueing mechanism in front of Elasticsearch for spikes in the data, however the use case is near real time logs - sustained lag is not acceptable. We had a situation with sustained lag that we had to troubleshoot. Starting in the cluster view we pick up some useful information, in the image below we learn that there are 3 master nodes, 8 data nodes (and 3 other nodes that are not interesting to the case). We also learn that the cluster is red, (this could be networking or performance issues), the version is 8.5.1 and there are 6355 shards; these last 2 will become important later.
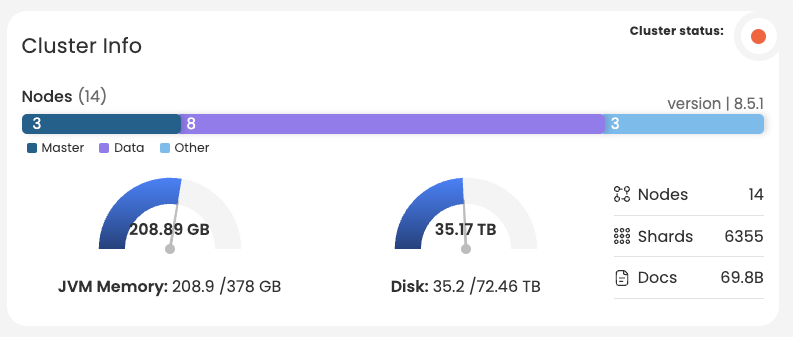
Image 2: Cluster Info
There is a lot going on in this cluster, it is going red a lot, these are related to the nodes leaving the cluster. The nodes are leaving the cluster around the time that we observe indexing rejections and the rejections are happening shortly after the indexing queues are getting filled up too frequently, the darker the yellow, the more high indexing events in the time block.
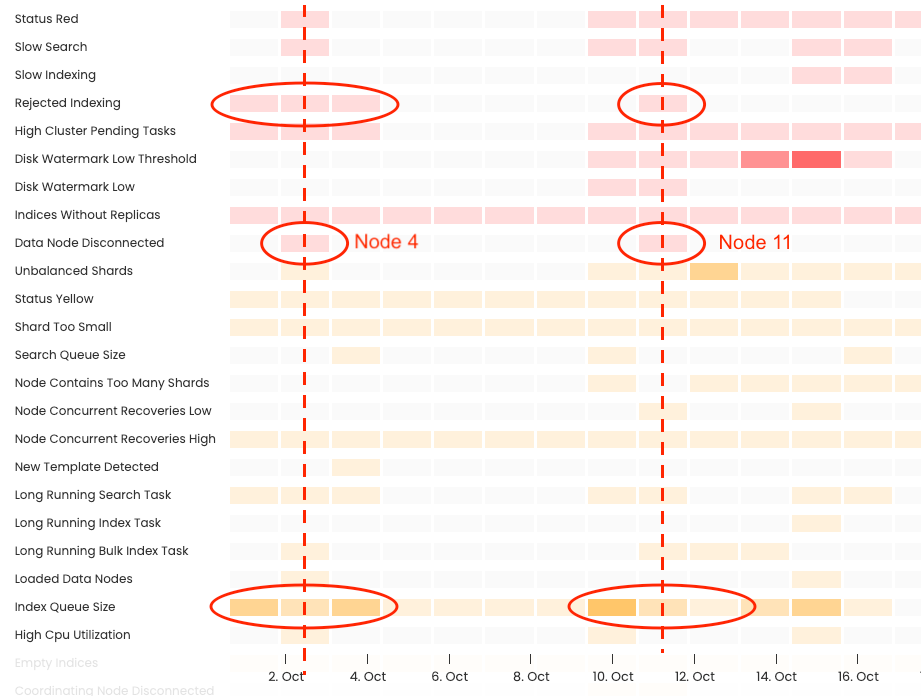
Image 3: Timeline of events in the cluster, (importantly let’s highlight Data Node Disconnected)
Moving to the node view and focusing in on the timeframe around the last node disconnect we can see that another node, node 9, has a much higher indexing rate than the rest of the nodes, followed by the second highest indexing rate observed on node 4, which has had some disconnects earlier in the month. You will also notice that there is a fairly large drop in indexing rate around the same timeframe, this was in fact also related to intermittent latency in this particular cluster between the compute resources and the storage.
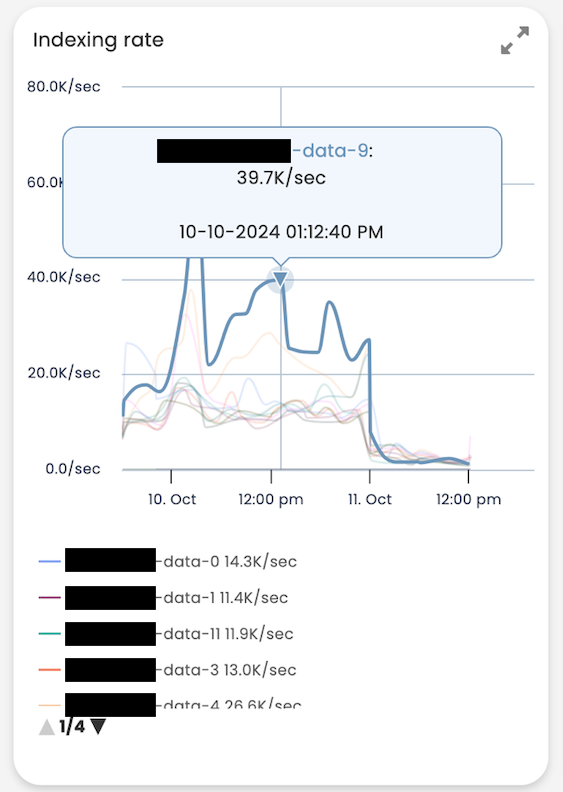
Image 4: Data node 9, high indexing rate.
AutoOps by default will only report nodes that disconnect for more than 300 seconds, but we know that other nodes including node 9 are frequently leaving the cluster, as can be seen in the image below, the number of shards on the node are growing too fast to be moving shards, therefore they must be re-initialising after a node disconnect/restart. With these pieces of information we can safely conclude that the cluster is experiencing a performance issue, but not only that it is a hotspotting performance issue. Since Elasticsearch works as a cluster, it can only work as fast as its slowest node and since node 9 is being asked to do more work than the other nodes and it can’t keep up, the other nodes are always waiting for it and are occasionally getting disconnected themselves.
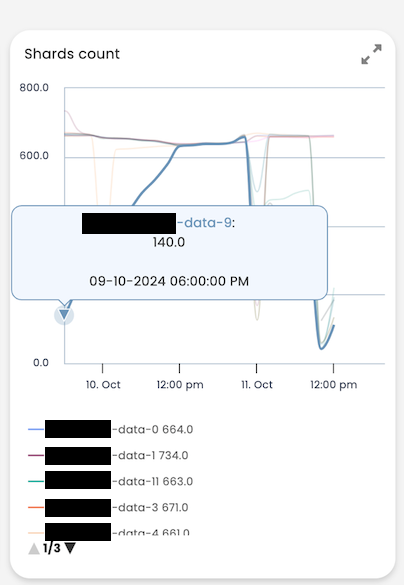
Image 5: Data node 9, number of shards increasing.
We do not need more information at this point, but to further illustrate the power of AutoOps below is another image which shows how much more work node 9 is doing than the other nodes, specifically how much data it is writing to disk.
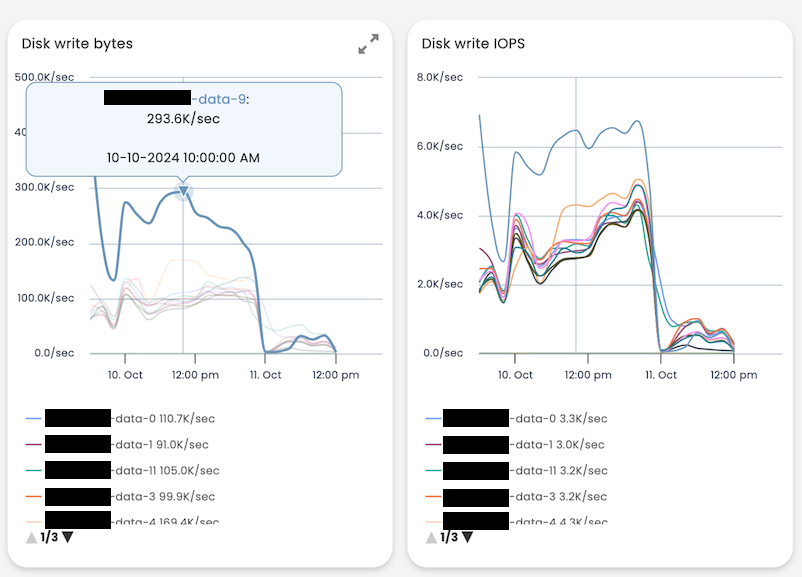
Image 6: Disk write and IOPS.
We decided to move all the shards off of node 9, by randomly sending them to the rest of the nodes in the cluster; this was achieved with the following command. After this the indexing performance of the whole cluster improved and the lag disappeared.
PUT /_cluster/settings
{
  "transient": {
    "cluster.routing.allocation.exclude._name": "****-data-9"
  }
}
Now that we have observed, confirmed and circumvented the issue, we need to find a long term solution to the problem, which brings us back to the technical analysis at the beginning of the blog. The best practices were being followed, the shards rolled at a predetermined size and we were even limiting the number of shards for a specific index per node. We hit an edge case that the algorithm could not deal with, heavy index and frequently rolled indices.
We thought about whether we could rebalance the cluster manually, but with around 2000 indices made up of 6355 shards, this was not going to be trivial, not to mention, with this level of indexing we would be racing against ILM to rebalance. This is exactly what the new algorithm was designed for and so our final recommendation is to upgrade the cluster.
Final thoughts
This blog is a summary of a fairly specific but complicated set of circumstances that can cause a problem with Elasticsearch performance. You may even see some of these issues in your cluster today but may never get into a position where your cluster is affected as badly as this user was. This case underscores the importance of keeping up with the latest versions of Elasticsearch to consistently take advantage of the latest innovations in managing data better and it helps to showcase the power of AutoOps in finding/diagnosing and alerting us to issues, before they become full production incidents.
Thinking about migrating to at least version 8.8 https://www.elastic.co/guide/en/elasticsearch/reference/8.8/migrating-8.8.html
Ready to try this out on your own? Start a free trial.
Want to get Elastic certified? Find out when the next Elasticsearch Engineer training is running!
Related content
November 6, 2024
AutoOps makes every Elasticsearch deployment simple(r) to manage
AutoOps for Elasticsearch significantly simplifies cluster management with performance recommendations, resource utilization and cost insights, real-time issue detection and resolution paths.