All Articles

Android application monitoring with OpenTelemetry: distributed tracing from tap to backend
EDOT Android adds mobile APM to your Android app with one Gradle dependency: crash reporting, session tracking and distributed tracing visible in Kibana.
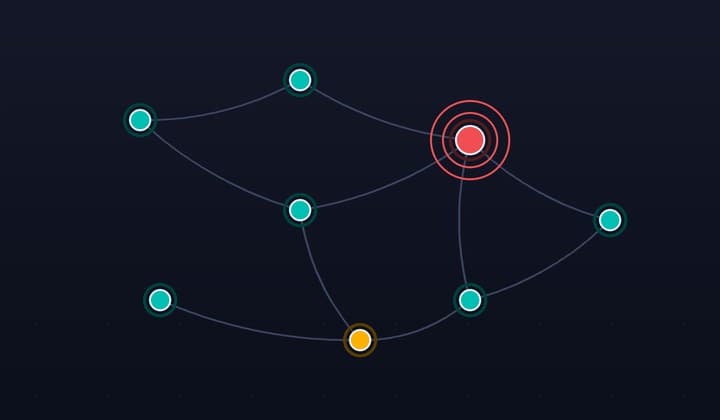
How we rebuilt the APM service map for incident time: the design story behind Observability 9.5
14 enterprise interviews, two prototype rounds, one rebuilt APM service map. The design story behind Elastic Observability 9.5.
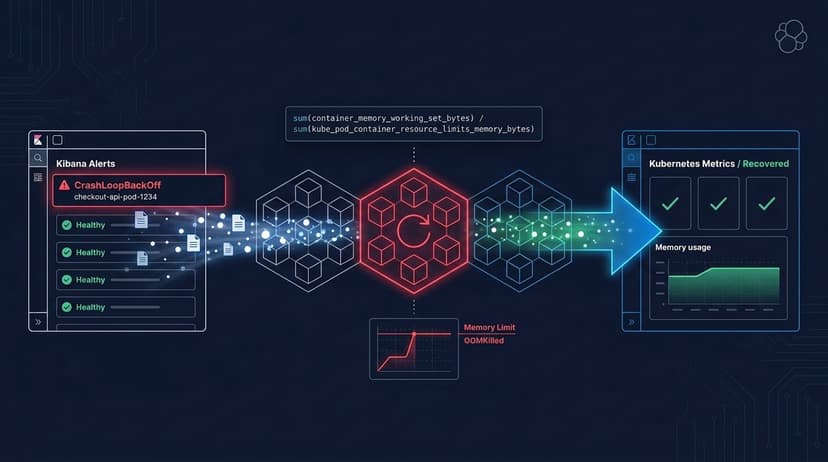
From CrashLoopBackOff to OOMKilled with PromQL in Elasticsearch and Kibana
Use PromQL in Elasticsearch and Kibana to move from a CrashLoopBackOff alert to OOMKilled, memory versus the limit, and a verified fix.
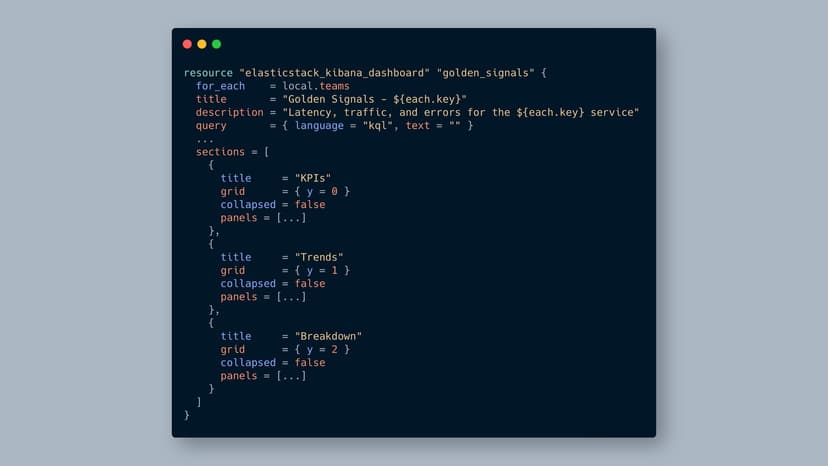
One edit, every dashboard updated: managing Kibana observability at scale with Terraform
Define your golden-signals panels once in a shared HCL library and use for_each to generate every team's dashboard, with drift detection and git rollback built in.
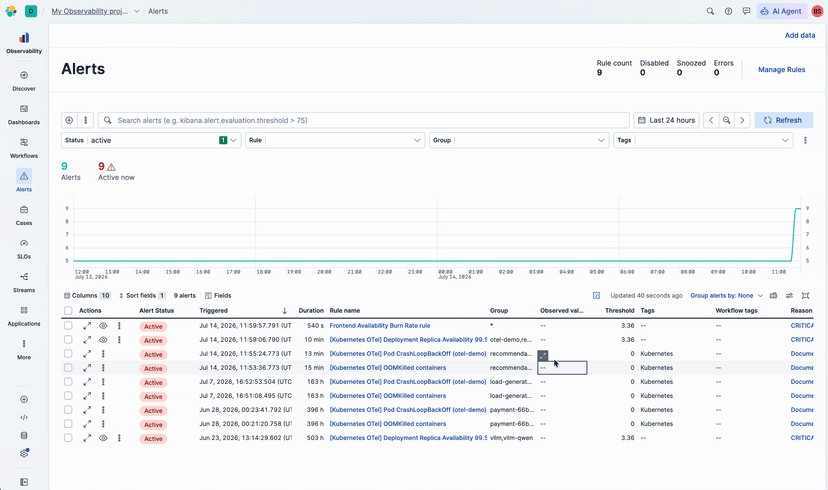
CrashLoopBackOff to root cause in seconds: automating the 20-minute Kubernetes investigation with Elastic Observability
Elastic's Kubernetes Experience fires alongside the CrashLoopBackOff alert and delivers a root-cause hypothesis with evidence before you even open it.

Skip writing alert rules: 6 ready-made ES|QL templates ship inside the NGINX OTel integration
Elastic integrations come with alerting rule templates, each one an ES|QL query with a threshold already set. Create Elasticsearch alert rules in minutes, tune them to your traffic, and catch silent data streams early.
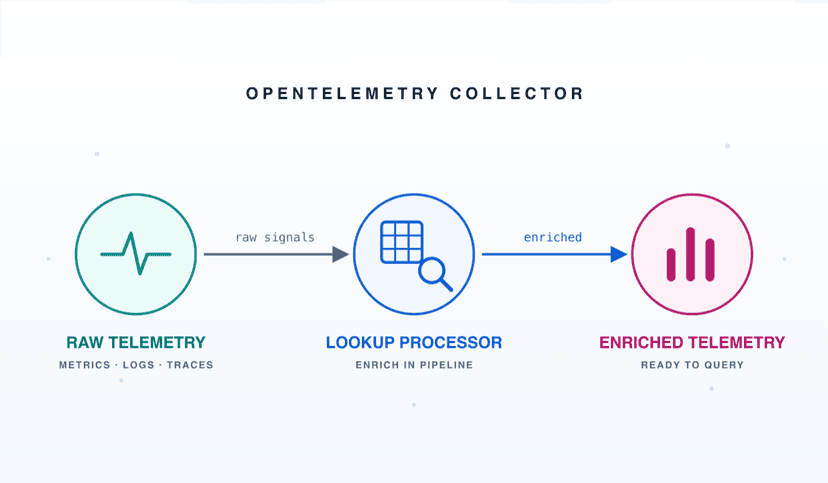
You have the IP, you want the hostname: building a lookup processor for OpenTelemetry
Look up any value from YAML, CSV or DNS inside the OpenTelemetry Collector or wire in your own source through a processor Elastic built and shipped to Collector Contrib.
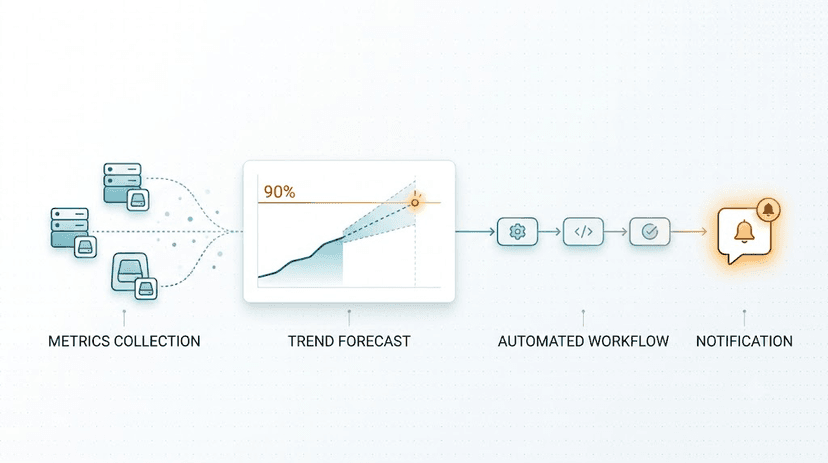
Elastic ML predicts when your disk will fill up: How to make it alert you
Use a single Kibana Workflows YAML to run daily ML forecasts on disk usage and get Slack alerts listing which hosts will hit capacity and when.
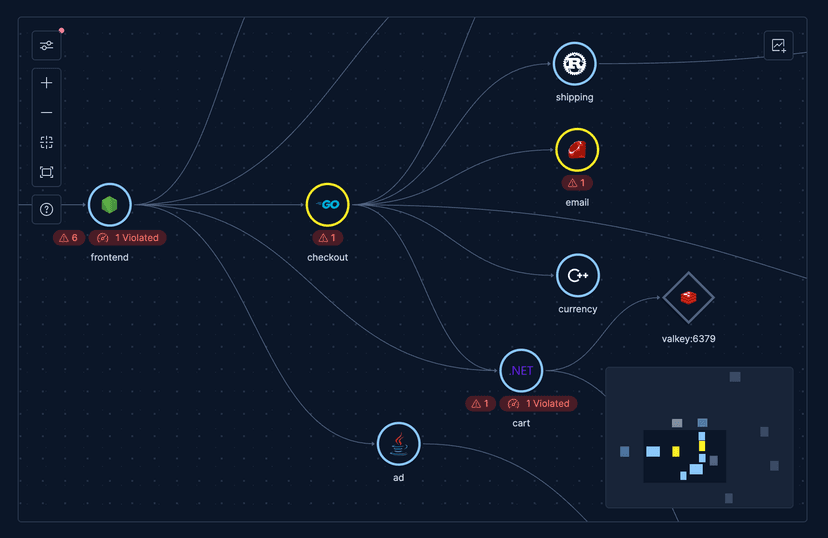
6x faster at 500 services: how we rebuilt the Kibana APM service map from canvas to React DOM
Each service node shows alert, SLO and anomaly health so you can filter to breaching services only and embed the result on any Kibana dashboard, with full keyboard navigation across the topology.
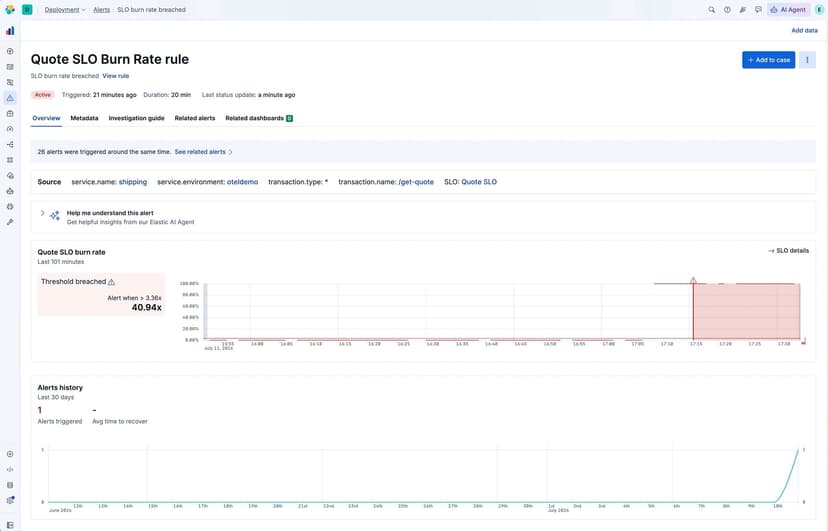
Your SLO is on fire; here's how to find the arsonist in Elastic Observability
When SLO alerting flags a burn rate spike, follow the SLI from the alert detail page through bad event spans and trace waterfalls to find the exact dependency burning your SLO error budget, all without leaving the investigation.
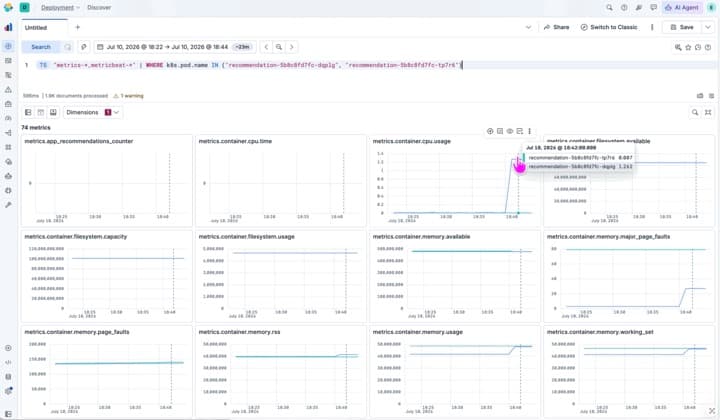
Four clicks from alert to root cause: how Elastic Observability links APM services to Kubernetes infrastructure
Check service dependencies and compare per-pod CPU, memory and network trends on the Infrastructure tab to find which instance is causing trouble, all without leaving the alert investigation.
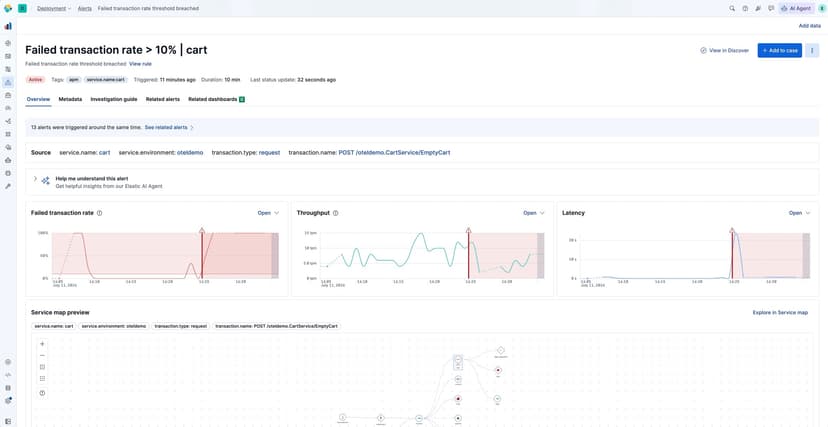
Three clicks from alert to error log: breaking down RED metrics by any span attribute in Elastic Observability
See which pod, deployment or version is driving a RED metrics change by breaking down span attributes in Discover, then trace a failing span to the error log behind it.