OpenTelemetry Articles

Android application monitoring with OpenTelemetry: distributed tracing from tap to backend
EDOT Android adds mobile APM to your Android app with one Gradle dependency: crash reporting, session tracking and distributed tracing visible in Kibana.
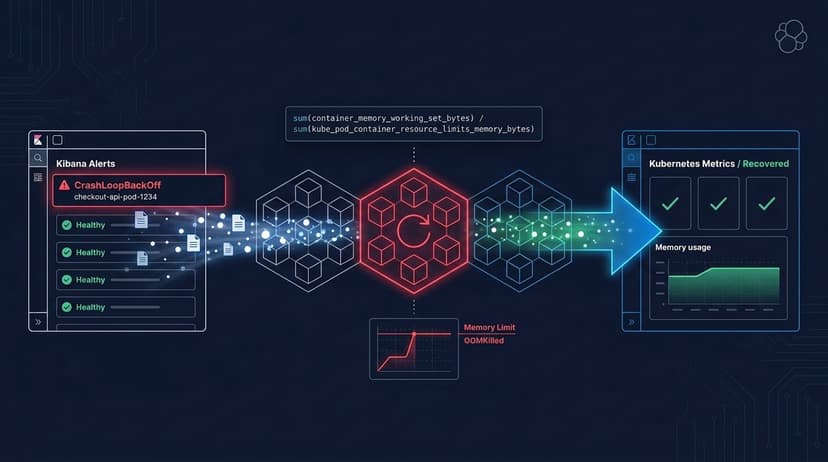
From CrashLoopBackOff to OOMKilled with PromQL in Elasticsearch and Kibana
Use PromQL in Elasticsearch and Kibana to move from a CrashLoopBackOff alert to OOMKilled, memory versus the limit, and a verified fix.
Skip writing alert rules: 6 ready-made ES|QL templates ship inside the NGINX OTel integration
Elastic integrations come with alerting rule templates, each one an ES|QL query with a threshold already set. Create Elasticsearch alert rules in minutes, tune them to your traffic, and catch silent data streams early.
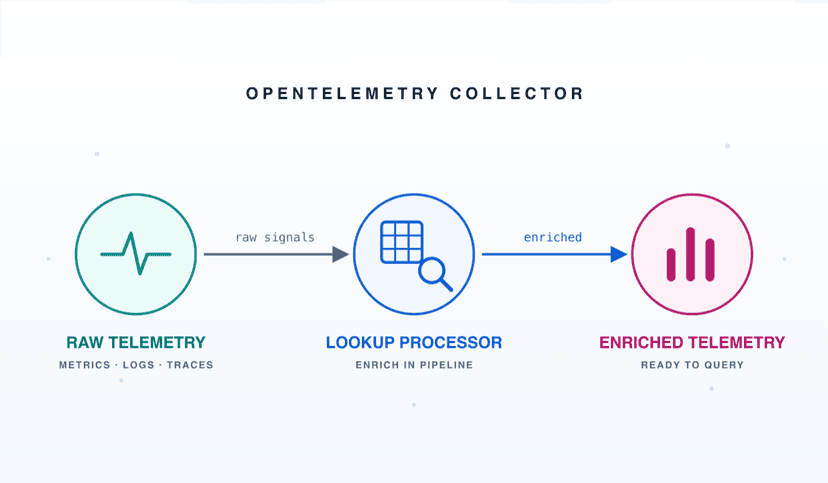
You have the IP, you want the hostname: building a lookup processor for OpenTelemetry
Look up any value from YAML, CSV or DNS inside the OpenTelemetry Collector or wire in your own source through a processor Elastic built and shipped to Collector Contrib.
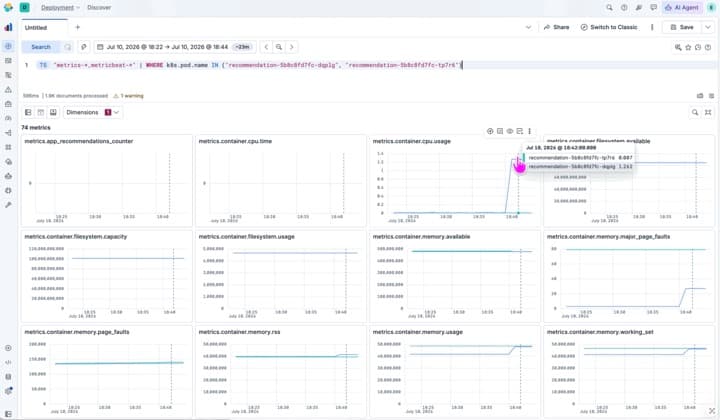
Four clicks from alert to root cause: how Elastic Observability links APM services to Kubernetes infrastructure
Check service dependencies and compare per-pod CPU, memory and network trends on the Infrastructure tab to find which instance is causing trouble, all without leaving the alert investigation.
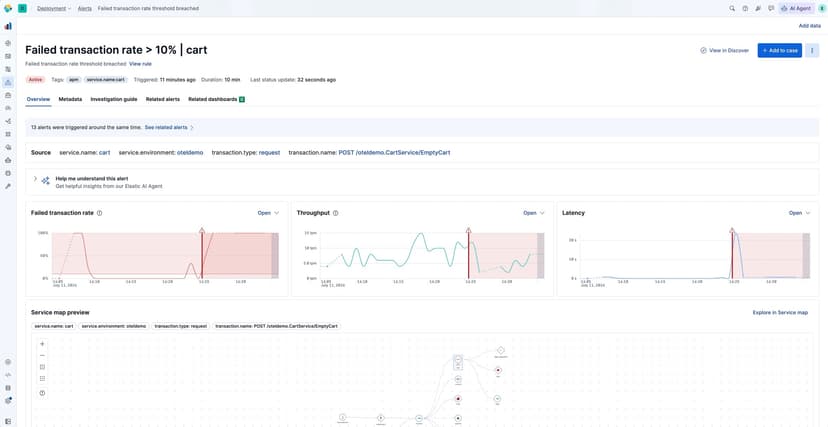
Three clicks from alert to error log: breaking down RED metrics by any span attribute in Elastic Observability
See which pod, deployment or version is driving a RED metrics change by breaking down span attributes in Discover, then trace a failing span to the error log behind it.
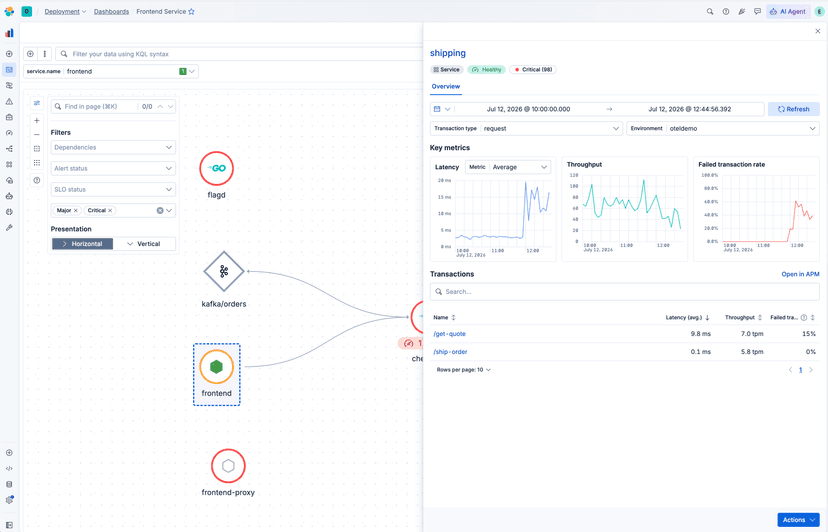
From alert to failing dependency in four clicks: Elastic APM's embedded service map
The APM service map is now embedded on alert pages with filters, connection metrics and a service fly-out so you can analyse dependencies and find the root cause without leaving the alert.
How Elastic cut OpenTelemetry tail sampling memory by 65% with disk-backed trace storage
Elastic contributed two features upstream to the OTel Collector's tail sampling processor. The span-ingest strategy lets sampling decisions happen earlier, and Pebble tail storage moves trace buffering to disk. It costs more CPU, but operators can raise decision_wait and num_traces without OOM kills.

Common ES|QL queries for Kubernetes monitoring
Copy-paste ES|QL queries for Elasticsearch that turn memory pressure and error spikes into a five-minute diagnosis.
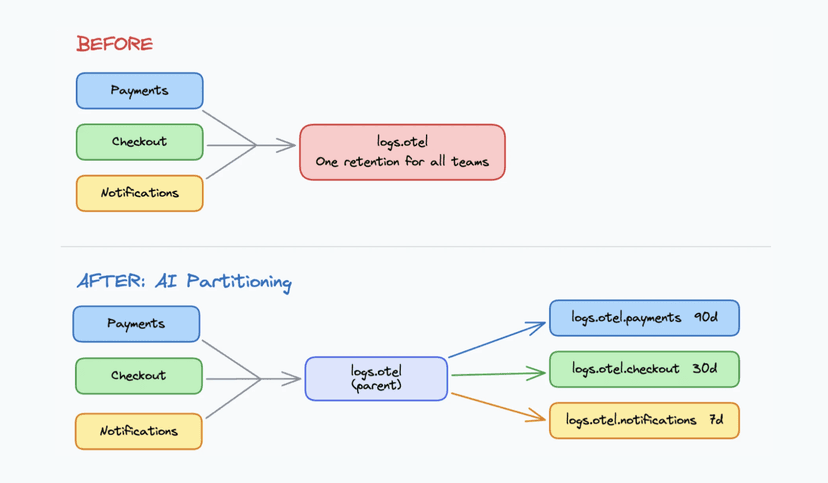
One OTLP endpoint, three teams, zero routing rules: Elasticsearch Streams AI Partitioning
Stop writing log routing rules upfront. See how Streams AI Partitioning reads your data, proposes child streams, and lets you set per-team retention in minutes.
Elasticsearch: best-in-class for logs, now best-in-class for metrics
Elasticsearch is now best-in-class for metrics: 30× faster than Prometheus, up to 2.5× more storage-efficient, 50% less than Datadog. Learn about all the capabilities we’ve added.

3 signals, 2 env vars, 0 collectors: OpenTelemetry with Python and Elastic's Managed OTLP Endpoint
Instrument a Flask API with OpenTelemetry and ship traces, metrics, and logs to Elastic Cloud using just 2 environment variables, no collector needed.