Observability Articles
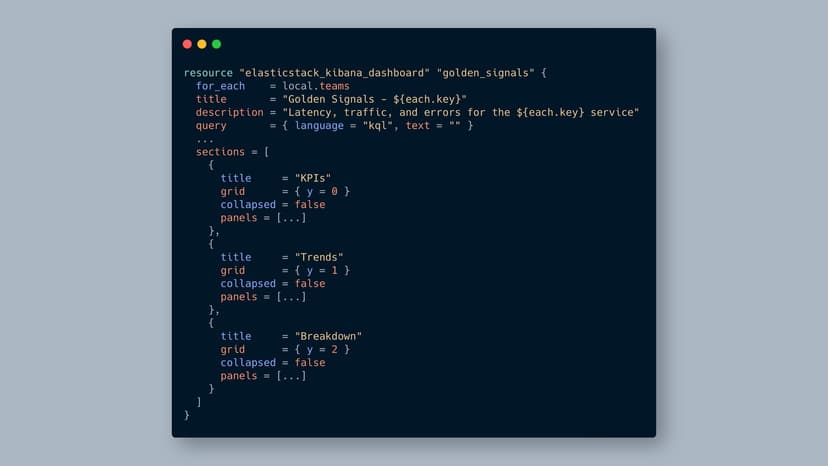
One edit, every dashboard updated: managing Kibana observability at scale with Terraform
Define your golden-signals panels once in a shared HCL library and use for_each to generate every team's dashboard, with drift detection and git rollback built in.
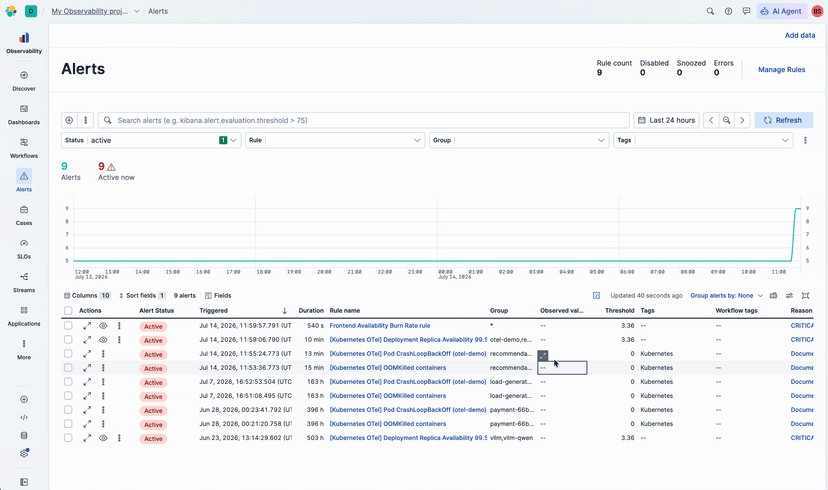
CrashLoopBackOff to root cause in seconds: automating the 20-minute Kubernetes investigation with Elastic Observability
Elastic's Kubernetes Experience fires alongside the CrashLoopBackOff alert and delivers a root-cause hypothesis with evidence before you even open it.
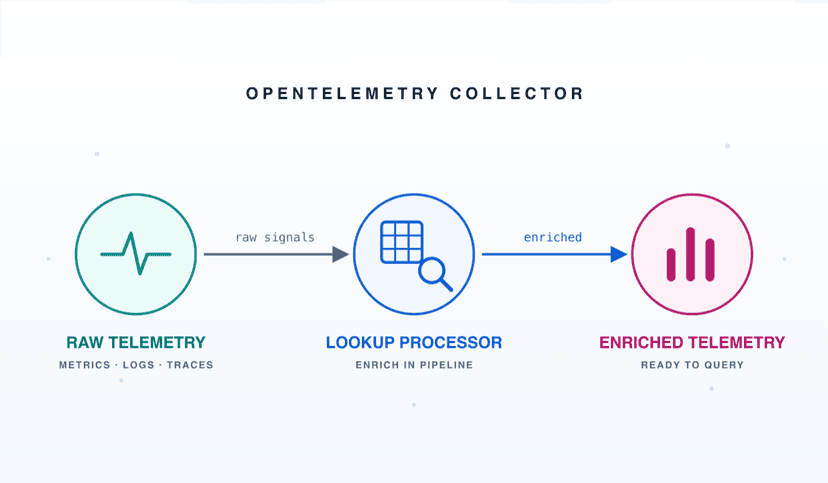
You have the IP, you want the hostname: building a lookup processor for OpenTelemetry
Look up any value from YAML, CSV or DNS inside the OpenTelemetry Collector or wire in your own source through a processor Elastic built and shipped to Collector Contrib.
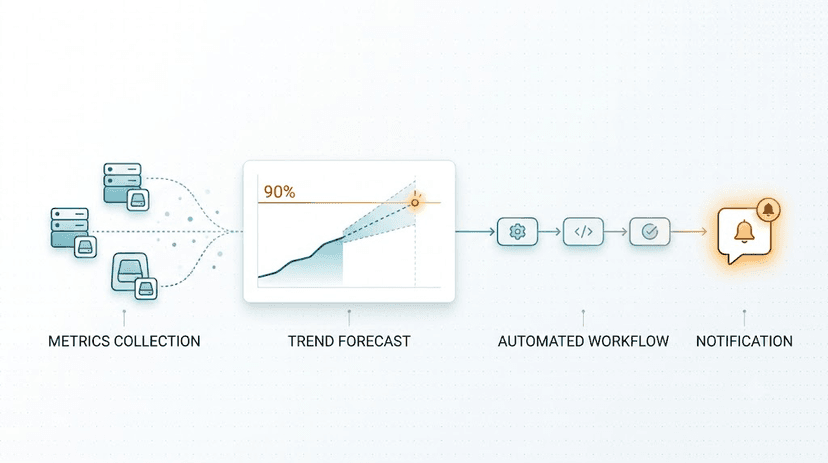
Elastic ML predicts when your disk will fill up: How to make it alert you
Use a single Kibana Workflows YAML to run daily ML forecasts on disk usage and get Slack alerts listing which hosts will hit capacity and when.

Migrate Datadog Kubernetes dashboards to Elastic Observability in under an hour
See how the migration CLI translates a real Datadog Kubernetes dashboard into validated Kibana panels and uploads it to your cluster in under an hour, no manual widget rebuilds required.
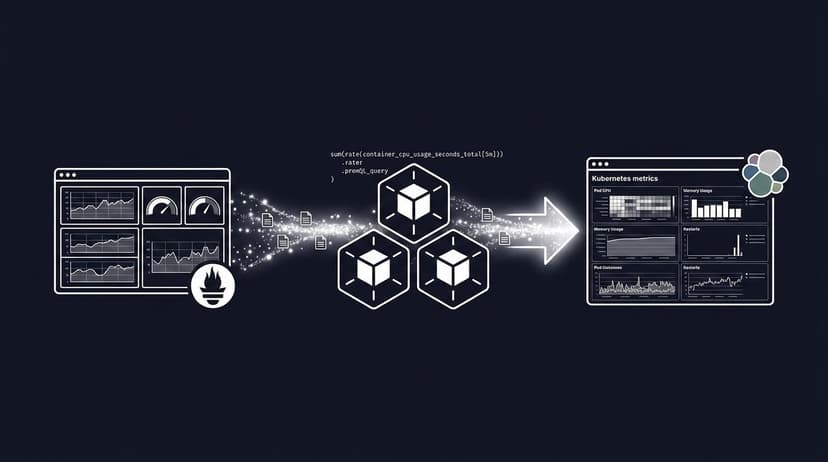
Migrate your Grafana Kubernetes dashboard to Elastic Observability: same PromQL, 30x faster queries
Take a real Grafana Kubernetes dashboard covering pod CPU, memory, node pressure, and restart counts, then migrate it into Elastic Observability with native PromQL in under an hour.
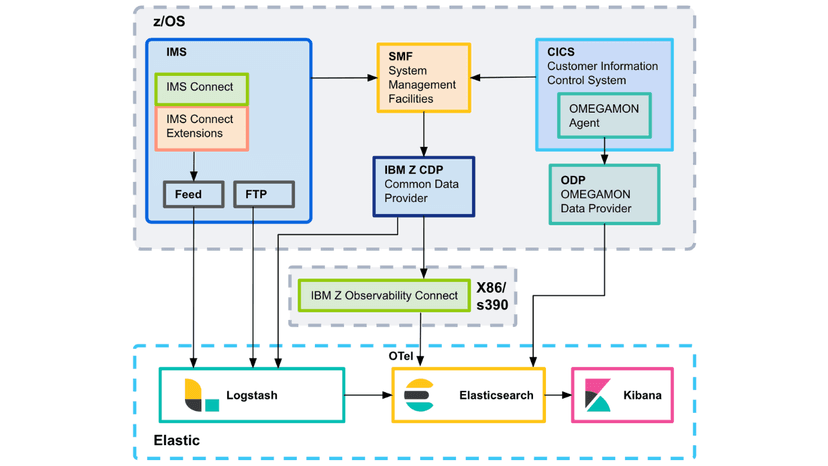
Elastic z/OS ingest: five architectures for mainframe data
This field guide walks through the ingest architectures I've seen work in production, the data quality checks that decide whether your dashboards actually work, and the ECS mapping that makes mainframe data usable to the platform.
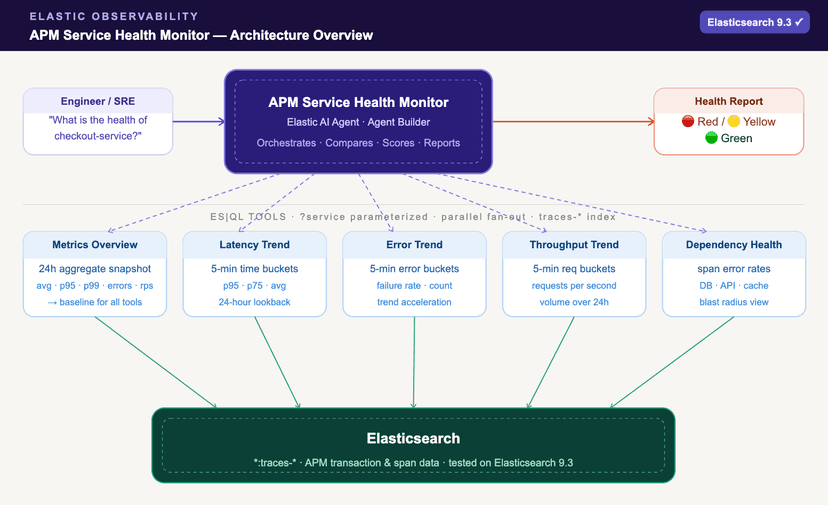
From five dashboards to one prompt: how we built an APM health monitor with Elastic Agent Builder
Five ES|QL tools score latency, errors, throughput and dependencies to find the root cause, so you don't dashboard-hop during an APM incident.

Common ES|QL queries for Kubernetes monitoring
Copy-paste ES|QL queries for Elasticsearch that turn memory pressure and error spikes into a five-minute diagnosis.

3 signals, 2 env vars, 0 collectors: OpenTelemetry with Python and Elastic's Managed OTLP Endpoint
Instrument a Flask API with OpenTelemetry and ship traces, metrics, and logs to Elastic Cloud using just 2 environment variables, no collector needed.

TLS certificate monitoring with Elastic Workflows, Synthetics, and Osquery: Eliminate manual renewals
Automate TLS certificate monitoring with Elastic Workflows, Synthetics, and Osquery. Detect expiring certificates, rotate, and verify without human intervention.

Migrating Datadog and Grafana dashboards and alerts to Kibana with the Observability Migration Platform
Learn how to migrate supported Datadog and Grafana dashboards and alerts to Kibana with the Observability Migration Platform.