What is Logstash?
Logstash is a widely used Elastic Stack tool for processing large volumes of log data in real-time. It acts as an efficient data pipeline, integrating information from various sources into a single structured flow. Its primary function is to reliably perform data extraction, transformation, and loading.
Logstash offers several advantages, particularly its versatility in supporting multiple types of inputs, filters, and outputs, enabling integration with a wide range of sources and destinations. It processes data in real-time, capturing and transforming information. Its native integration with the Elastic Stack, especially Elasticsearch and Kibana, facilitates data analysis and visualization. Additionally, it includes advanced filters that enable efficient data normalization, enrichment, and transformation.
How does Logstash work?
Logstash is composed of inputs, filters, and outputs, which form the data processing pipeline. These components are configured in a .config file that defines the data ingestion flow.
- Inputs: Capture data from various sources.
- Filters: Process and transform the captured data.
- Outputs: Send the transformed data to defined destinations.
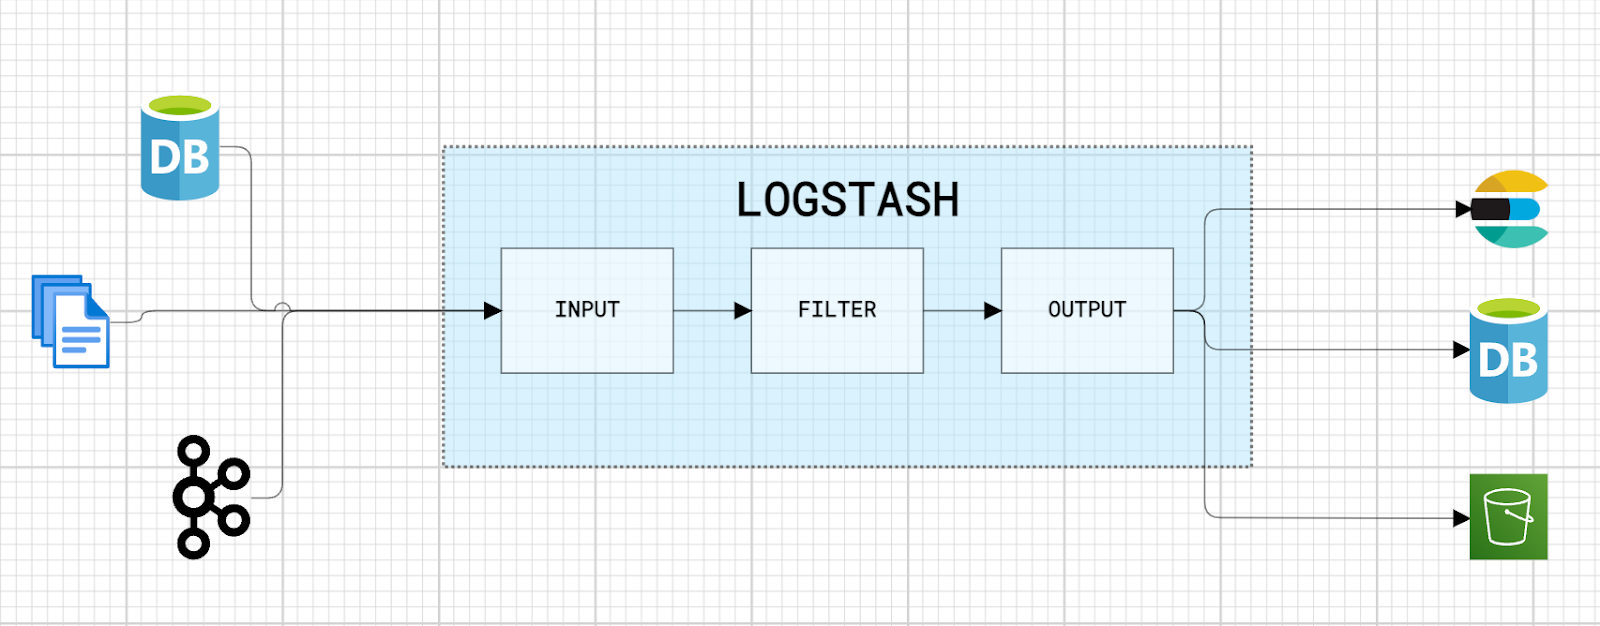
The most common types of each component are presented below:
Types of Inputs:
- File: Reads log files in various formats (text, JSON, CSV, etc.).
- Message Queues: Kafka, RabbitMQ.
- APIs: Webhooks or other data collection APIs.
- Databases: JDBC connections for relational data extraction.
Types of Filters:
- Grok: For analyzing and extracting text patterns.
- Mutate: Modifies fields (renames, converts types, removes data).
- Date: Converts date and time strings into a readable date format.
- GeoIP: Enriches logs with geographic data.
- JSON: Parses or generates JSON data.
Types of Outputs:
- Elasticsearch: The most common destination, Elasticsearch is a search and analytics engine that allows powerful searches and visualizations of data indexed by Logstash.
- Files: Stores processed data locally.
- Cloud Services: Logstash can send data to various cloud services, such as AWS S3, Google Cloud Storage, Azure Blob Storage, for storage or analysis.
- Databases: Logstash can send data to various other databases, such as MySQL, PostgreSQL, MongoDB, etc., through specific connectors.
Logstash Elasticsearch data ingestion
In this example, we implement data ingestion into Elasticsearch using Logstash. The steps configured in this example will have the following flow:
- Kafka will be used as the data source.
- Logstash will consume the data, apply filters such as grok, geoip, and mutate to structure it.
- The transformed data will be sent to an index in Elasticsearch.
- Kibana will be used to visualize the indexed data.
Prerequisites
We will use Docker Compose to create an environment with the necessary services: Elasticsearch, Kibana, Logstash, and Kafka. The Logstash configuration file, named logstash.conf, will be mounted directly into the Logstash container. Below we will detail the configuration of the configuration file.
Here is docker-compose.yml:
version: '3.8'
services:


 elasticsearch:
   image: docker.elastic.co/elasticsearch/elasticsearch:8.16.2
   container_name: elasticsearch-8.16.2
   environment:
     - node.name=elasticsearch
     - xpack.security.enabled=false
     - discovery.type=single-node
     - "ES_JAVA_OPTS=-Xms1024m -Xmx1024m"
   ports:
     - 9200:9200
   networks:
     - shared_network


 kibana:
   image: docker.elastic.co/kibana/kibana:8.16.2
   container_name: kibana-8.16.2
   restart: always
   environment:
     - ELASTICSEARCH_URL=http://elasticsearch:9200
   ports:
     - 5601:5601
   depends_on:
     - elasticsearch
   networks:
     - shared_network


 logstash:
   image: docker.elastic.co/logstash/logstash:8.16.2
   container_name: logstash-8.16.2
   volumes:
     - ./logstash.conf:/usr/share/logstash/pipeline/logstash.conf
   ports:
     - "5044:5044"
   depends_on:
     - elasticsearch
   networks:
     - shared_network


 zookeeper:
   image: confluentinc/cp-zookeeper:latest
   container_name: zookeeper
   environment:
     ZOOKEEPER_CLIENT_PORT: 2181
     ZOOKEEPER_TICK_TIME: 2000
   ports:
     - 2181:2181
   networks:
     - shared_network


 kafka:
   image: confluentinc/cp-kafka:latest
   container_name: kafka
   depends_on:
     - zookeeper
   environment:
     KAFKA_BROKER_ID: 1
     KAFKA_ZOOKEEPER_CONNECT: zookeeper:2181
     KAFKA_ADVERTISED_LISTENERS: PLAINTEXT://kafka:9092
     KAFKA_OFFSETS_TOPIC_REPLICATION_FACTOR: 1
   ports:
     - 9092:9092
   networks:
     - shared_network


networks:
 shared_network:
As mentioned above, the Logstash pipeline will be defined, in this step we will describe the Input, Filter and Output configurations.
The logstash.conf file will be created in the current directory (where docker-compose.yml is located). In docker-compose.yml the logstash.conf file that is on the local file system will be mounted inside the container at the path /usr/share/logstash/pipeline/logstash.conf.
Logstash pipeline configuration
The Logstash pipeline is divided into three sections: input, filter, and output.
- Input: Defines where the data will be consumed from (in this case, Kafka).
- Filter: Applies transformations and structuring to the raw data.
- Output: Specifies where the processed data will be sent (in this case, Elasticsearch).
Next, we will configure each of these steps in detail.
Input configuration
The data source is a Kafka topic and to consume the data from the topic it will be necessary to configure the Kafka input plugin. Below is the configuration for the Kafka plugin in Logstash, where we define:
- bootstrap_servers: Address of the Kafka server.
- topics: Name of the topic to be consumed.
- group_id: Consumer group identifier.
input {
 kafka {
   bootstrap_servers => "kafka:9092"
   topics => ["logs"]
   group_id => "logstash-consumer"
 }
}
With this, we are ready to receive the data.
Filter configuration
Filters are responsible for transforming and structuring data. Let's configure the following filters:
Grok filter
Extracts structured information from unstructured data. In this case, it extracts the timestamp, log level, client IP, URI, status, and the JSON payload.
grok {
 match => {
   "message" => "%{TIMESTAMP_ISO8601:timestamp},%{WORD:log_level},%{IP:client_ip},%{URIPATH:uri},%{NUMBER:status}"
 }
}
The example log:
2025-01-05 16:30:15,INFO,69.162.81.155,/api/products,200,{"user_id":123,"region":"US"}Extracted Fields:
- timestamp: Extracts the date and time (e.g., 2025-01-05T16:30:15).
- log_level: Captures the log level (e.g., INFO, ERROR).
- client_ip: Captures the client's IP address (e.g., 69.162.81.155).
- uri: Captures the URI path (e.g., /api/products).
- status: Captures the HTTP status code (e.g., 200).
Date filter
Converts the timestamp field into a format readable by Elasticsearch and stores it in @timestamp.
date {
    match => ["timestamp", "yyyy-MM-dd HH:mm:ss"]
    target => "@timestamp"
  }
GeoIP filter
Next, we will use the geoip filter to retrieve geographic information, such as country, region, city, and coordinates, based on the value of the client_ip field.
  geoip {
    source => "client_ip"
    target => "geoip"
  }
Mutate filter
The mutate filter allows transformations on fields. In this case, we will use two of its properties:
- remove_field: Removes the timestamp and message fields, as they are no longer needed.
- convert: Converts the status field from a string to an integer.
  mutate {
    remove_field => ["timestamp", "message"]
    convert => { "status" => "integer" }
  }
Output configuration
The output defines where the transformed data will be sent. In this case, we will use Elasticsearch.
output {
 elasticsearch {
   hosts => ["http://172.21.0.1:9200"]
   index => "webapp_logs"
 }
}
We now have our configuration file defined. Below is the complete file:
input {
 kafka {
   bootstrap_servers => "kafka:9092"
   topics => ["logs"]
   group_id => "logstash-consumer"
 }
}


filter {
 grok {
   match => {
     "message" => "%{TIMESTAMP_ISO8601:timestamp},%{WORD:log_level},%{IP:client_ip},%{URIPATH:uri},%{NUMBER:status}"
   }
 }


 date {
   match => ["timestamp", "yyyy-MM-dd HH:mm:ss"]
   target => "@timestamp"
 }


 geoip {
   source => "client_ip"
   target => "geoip"
 }


 mutate {
   remove_field => ["timestamp", "message"]
   convert => { "status" => "integer" }
 }
}


output {
 elasticsearch {
   hosts => ["http://172.21.0.1:9200"]
   index => "webapp_logs"
 }
}
Send and ingest data
With the containers running, we can start sending messages to the topic and wait for the data to be indexed. First, create the topic if you haven't already.
docker exec -it kafka kafka-topics --create --topic logs --bootstrap-server kafka:9092 --partitions 1 --replication-factor 1To send the messages, execute the following command in the terminal:
docker exec -it kafka kafka-console-producer --topic logs --bootstrap-server kafka:9092Messages to be sent:
2025-01-05 16:30:15,INFO,69.162.81.155,/api/products,200,{"user_id":123,"region":"US"}
2025-01-05 16:31:02,ERROR,104.101.21.255,/api/orders,500,{"user_id":124,"region":"BR"}
2025-01-05 16:32:45,INFO,103.244.145.255,/api/cart,404,{"user_id":125,"region":"DE"}
To view the indexed data, go to Kibana:
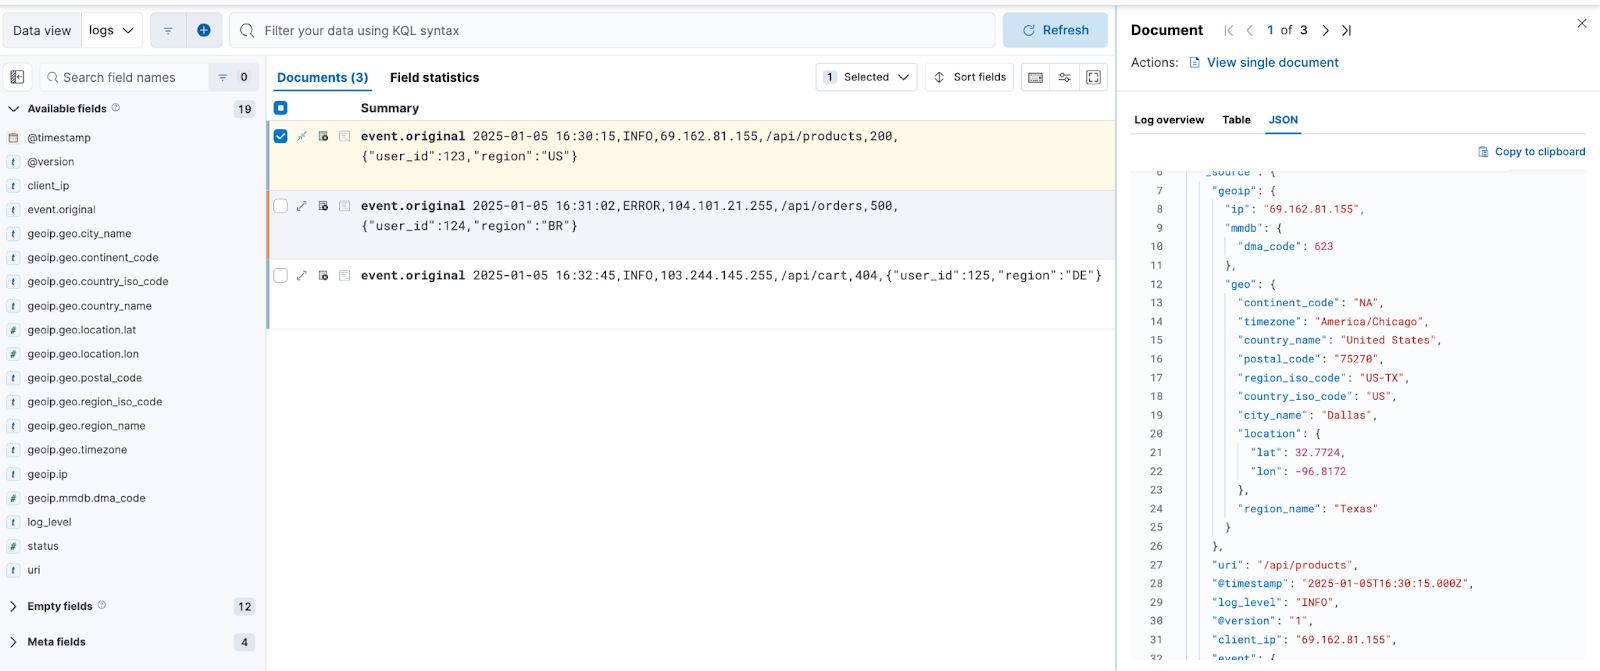
Once the indexing has been successfully completed, we can view and analyze the data in Kibana. The mapping and indexing process ensures that the fields are structured according to the configurations defined in Logstash.
Conclusion
With the configuration presented, we created a pipeline using Logstash to index logs in a containerized environment with Elasticsearch and Kafka. We explored Logstash's flexibility to process messages using filters such as grok, date, geoip, and mutate, structuring the data for analysis in Kibana. Additionally, we demonstrated how to configure the integration with Kafka to consume messages and use them for processing and indexing the data.
References
Logstash
https://www.elastic.co/guide/en/logstash/current/index.html
Logstash docker
https://www.elastic.co/guide/en/logstash/current/docker.html
GeoIp plugin
https://www.elastic.co/guide/en/logstash/current/plugins-filters-geoip.html
Mutate plugin
https://www.elastic.co/guide/en/logstash/current/plugins-filters-mutate.html
Grok plugin
https://www.elastic.co/guide/en/logstash/current/plugins-filters-grok.html
Kafka plugin
https://www.elastic.co/guide/en/logstash/current/plugins-inputs-kafka.html
Ready to try this out on your own? Start a free trial.
Want to get Elastic certified? Find out when the next Elasticsearch Engineer training is running!
Related content

September 22, 2025
Elastic Open Web Crawler as a code
Learn how to use GitHub Actions to manage Elastic Open Crawler configurations, so every time we push changes to the repository, the changes are automatically applied to the deployed instance of the crawler.

August 6, 2025
How to display fields of an Elasticsearch index
Learn how to display fields of an Elasticsearch index using the _mapping and _search APIs, sub-fields, synthetic _source, and runtime fields.

July 14, 2025
Run Elastic Open Crawler in Windows with Docker
Learn how to use Docker to get Open Crawler working in a Windows environment.

June 24, 2025
Ruby scripting in Logstash
Learn about the Logstash Ruby filter plugin for advanced data transformation in your Logstash pipeline.

June 4, 2025
3 ingestion tips to change your search game forever
Get your Elasticsearch ingestion game to the next level by following these tips: data pre-processing, data enrichment and picking the right field types.