The frozen data tier can achieve both low cost and good performance by leveraging Elastic's Searchable Snapshots - which offer a compelling solution for managing vast amounts of data while maintaining the performant searchability of data within a budget.
In this article, we delve into a benchmark of Elastic's hot and frozen data tiers by running sample queries on 105 terabytes of logs spanning more than 90 days. These queries replicate common tasks within Kibana's Discover, including search with highlighting, total hits, date histogram aggregation, and terms aggregation; that all happen behind the scenes when a user triggers a simple search. The results reveal that Elastic's frozen data tier is quick and delivers latency comparable to its hot tier, with only the first query to the object store being slower - subsequent queries are fast.
We replicated the way a typical user would interact with a hot-frozen deployment through Kibana's Discover - its main interface for interacting with indexed documents.
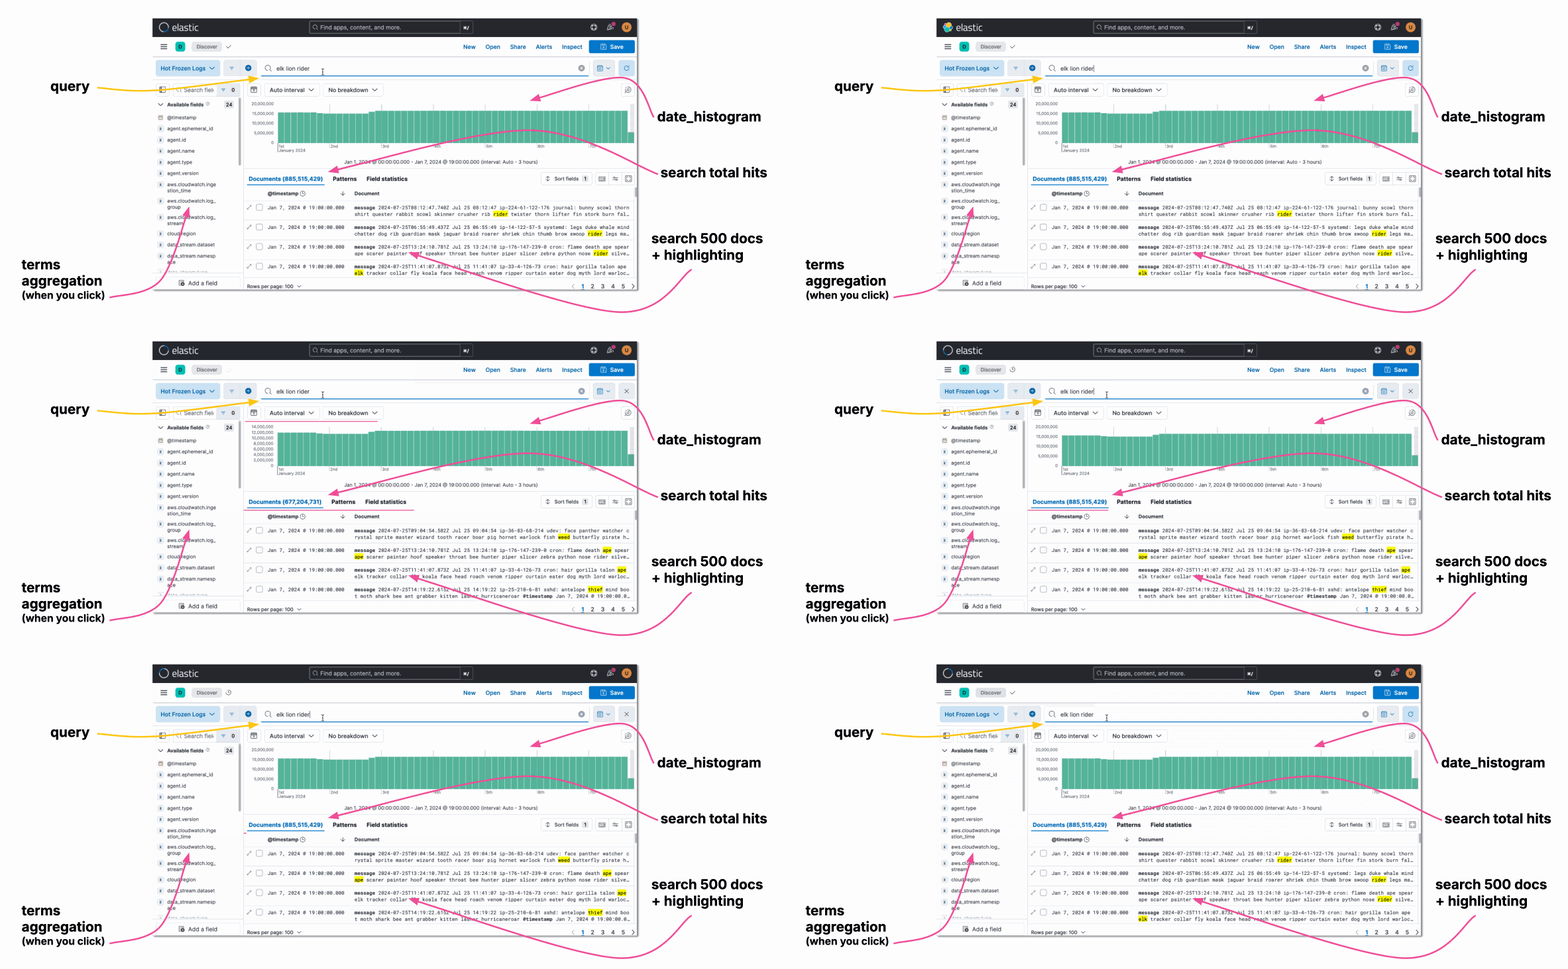
When a user issues a search using Discover's search bar three tasks are executed in parallel:
- a search and highlight operation on 500 docs that doesn't track the total amount of hits (referred as
discover_searchtasks on the results) - a search that tracks the total hits (
discover_search_totalin the results) - a date histogram aggregation to construct the bar chart (referred as
discover_date_histogram)
and also
- a terms aggregation (referred as
discover_terms_agg) when/if the user clicks the left side bar.
Data tiers in Elastic
Some types of data decrease in value over time. It's natural to think about application logs where the most recent records are usually the ones that need to be queried more frequently and also need the fastest possible response time. But there are several other examples of such data like medical records (detailed patient histories, diagnoses and physician notes); legal documents (contracts, court rulings, case files, etc.) and bank records (transaction records including descriptions of purchases and merchant names)-just to cite three. All contain unstructured or semi-structured text that requires efficient search capabilities to extract relevant information. As these records age, their immediate relevance may diminish, but they still hold significant value for historical analysis, compliance, and reference purposes.
Elastic's data tiers — Hot, Warm, Cold, and Frozen– provide the ideal balance of speed and cost, ensuring you maximize the value of these types of data as they age without sacrificing usability. Through both Kibana and Elasticsearch's search API the use of the underlying data tiers is always automatic and transparent–users don't need to issue search queries in a different way to retrieve data from any specific tier (no need to manually restore the data, or "rehydrate").
In this blog we keep it simple by using solely the Hot and Frozen tiers, in what is commonly called a hot-frozen scenario.
How the frozen tier works
In a hot-frozen scenario, data begins its journey in the hot tier, where it is actively ingested and queried. The hot tier is optimized for high-speed read and write operations, making it ideal for handling the most recent and frequently accessed data. As data ages and becomes less frequently accessed, it is transitioned to the frozen tier to optimize storage costs and resource utilization.
The transition from the hot tier to the frozen tier involves converting the data into searchable snapshots. Searchable snapshots leverage the snapshot mechanism used for backups, allowing the data to be stored in a cost-effective manner while still being searchable. This eliminates the need for replica shards, significantly reducing the local storage requirements.
Once the data is in the frozen tier, it is managed by nodes specifically designated for this purpose. These nodes do not need to have enough disk space to store full copies of all indices. Instead, they utilize an on-disk Least Frequently Used (LFU) cache. This cache stores only portions of the index data that are downloaded from the blob store as needed to serve queries. The on-disk cache functions similarly to an operating system's page cache, enhancing access speed to frequently requested parts of the data.
When a query is executed in the frozen tier, the process involves several steps to ensure efficient data retrieval and caching:
1. Read requests mapping: At the Lucene level, read requests are mapped to the local cache. This mapping determines whether the requested data is already present in the cache.
2. Cache mishandling: If the required data is not available in the local cache (a cache miss), Elasticsearch handles this by downloading a larger region of the Lucene file from the blob store. Typically, this region is a 16MB chunk, which is a balance between minimizing the number of fetches and optimizing the amount of data transferred.
3. Adding data to cache: The downloaded chunk is then added to the local cache. This process ensures that subsequent read requests for the same region can be served directly from the local cache, significantly improving query performance by reducing the need to repeatedly fetch data from the blob store.
4. Cache configuration options:
- Shared cache size: This setting accepts either a percentage of the total disk space or an absolute byte value. For dedicated frozen tier nodes, the default is 90% of the total disk space.
xpack.searchable.snapshot.shared_cache.size: 4TB- Max headroom: Defines the maximum headroom to maintain. If not explicitly set, it defaults to 100GB for dedicated frozen tier nodes.
xpack.searchable.snapshot.shared_cache.size.max_headroom: 100GB5. Eviction policy: The node-level shared cache uses a LFU policy to manage its contents. This policy ensures that frequently accessed data remains in the cache, while less frequently accessed data is evicted to make room for new data. This dynamic management of the cache helps maintain efficient use of disk space and quick access to the most relevant data.
6. Lucene index management: To further optimize resource usage, the Lucene index is opened only on-demand—when there is an active search. This approach allows a large number of indices to be managed on a single frozen tier node without consuming excessive memory.
Methodology
We ran the tests on a six node cluster in Elastic Cloud hosted on Google Cloud Platform on N2 family nodes:
- 3 x
gcp.es.datahot.n2.68x10x45- Storage-optimized Elasticsearch instances for hot data. - 3 x
gcp.es.datafrozen.n2.68x10x90- Storage-optimized (dense) Elasticsearch instances serving as a cache tier for frozen data.
We measured the following spans, which also equate to Terabytes in size, since we indexed one Terabyte per day.

We used Rally to run the tests, below is a sample test relative to an uncached search on one day of frozen data (discover_search_total-1d-frozen-nocache), iterations refer to the number of times the entire set of operations is repeated, which in this case is 10. Each operation defines a specific task or set of tasks to be performed, and in this example, it is a composite operation. Within this operation, there are multiple requests that specify the actions to be taken, such as clearing the frozen cache by issuing a POST request. The stream within a request indicates a sequence of related actions, such as submitting a search query and then retrieving and deleting the results.
{
  "iterations": 10,
  "operation": {
    "operation-type": "composite",
    "name": "discover_search_total-1d-frozen-nocache",
    "requests": [
      {
        "name": "clear-frozen-cache",
        "operation-type": "raw-request",
        "path": "/_searchable_snapshots/cache/clear",
        "method": "POST"
      },
      {
        "stream": [
          {
            "name": "async-search",
            "operation-type": "submit-async-search",
            "index": "hotfrozenlogs",
            "request-params": {
              "track_total_hits": "true"
            },
            "body": {
              "_source": false,
              "size": 0,
              "query": {
                "bool": {
                  "filter": [
                    {
                      "multi_match": {
                        "type": "best_fields",
                        "query": "elk lion rider",
                        "lenient": true
                      }
                    },
                    {
                      "range": {
                        "@timestamp": {
                          "format": "strict_date_optional_time",
                          "gte": "2024-02-15T00:00:00",
                          "lt": "2024-02-16T00:00:00"
                        }
                      }
                    }
                  ]
                }
              },
              "stored_fields": [
                "*"
              ],
              "fields": [
                {
                  "field": "@timestamp",
                  "format": "date_time"
                }
              ]
            }
          }
        ]
      },
      {
        "operation-type": "get-async-search",
        "retrieve-results-for": [
          "async-search"
        ]
      },
      {
        "operation-type": "delete-async-search",
        "delete-results-for": [
          "async-search"
        ]
      }
    ]
  }
}
Each test would run for 10 times per benchmark run, and we performed 500 benchmark runs across several days, therefore the sample for each task is 5,000. Having a high amount of measurements is essential when we want to ensure statistical significance and reliability of the results. This large sample size helps to smooth out anomalies and provides a more accurate representation of performance, allowing us to draw meaningful conclusions from the data.
Results
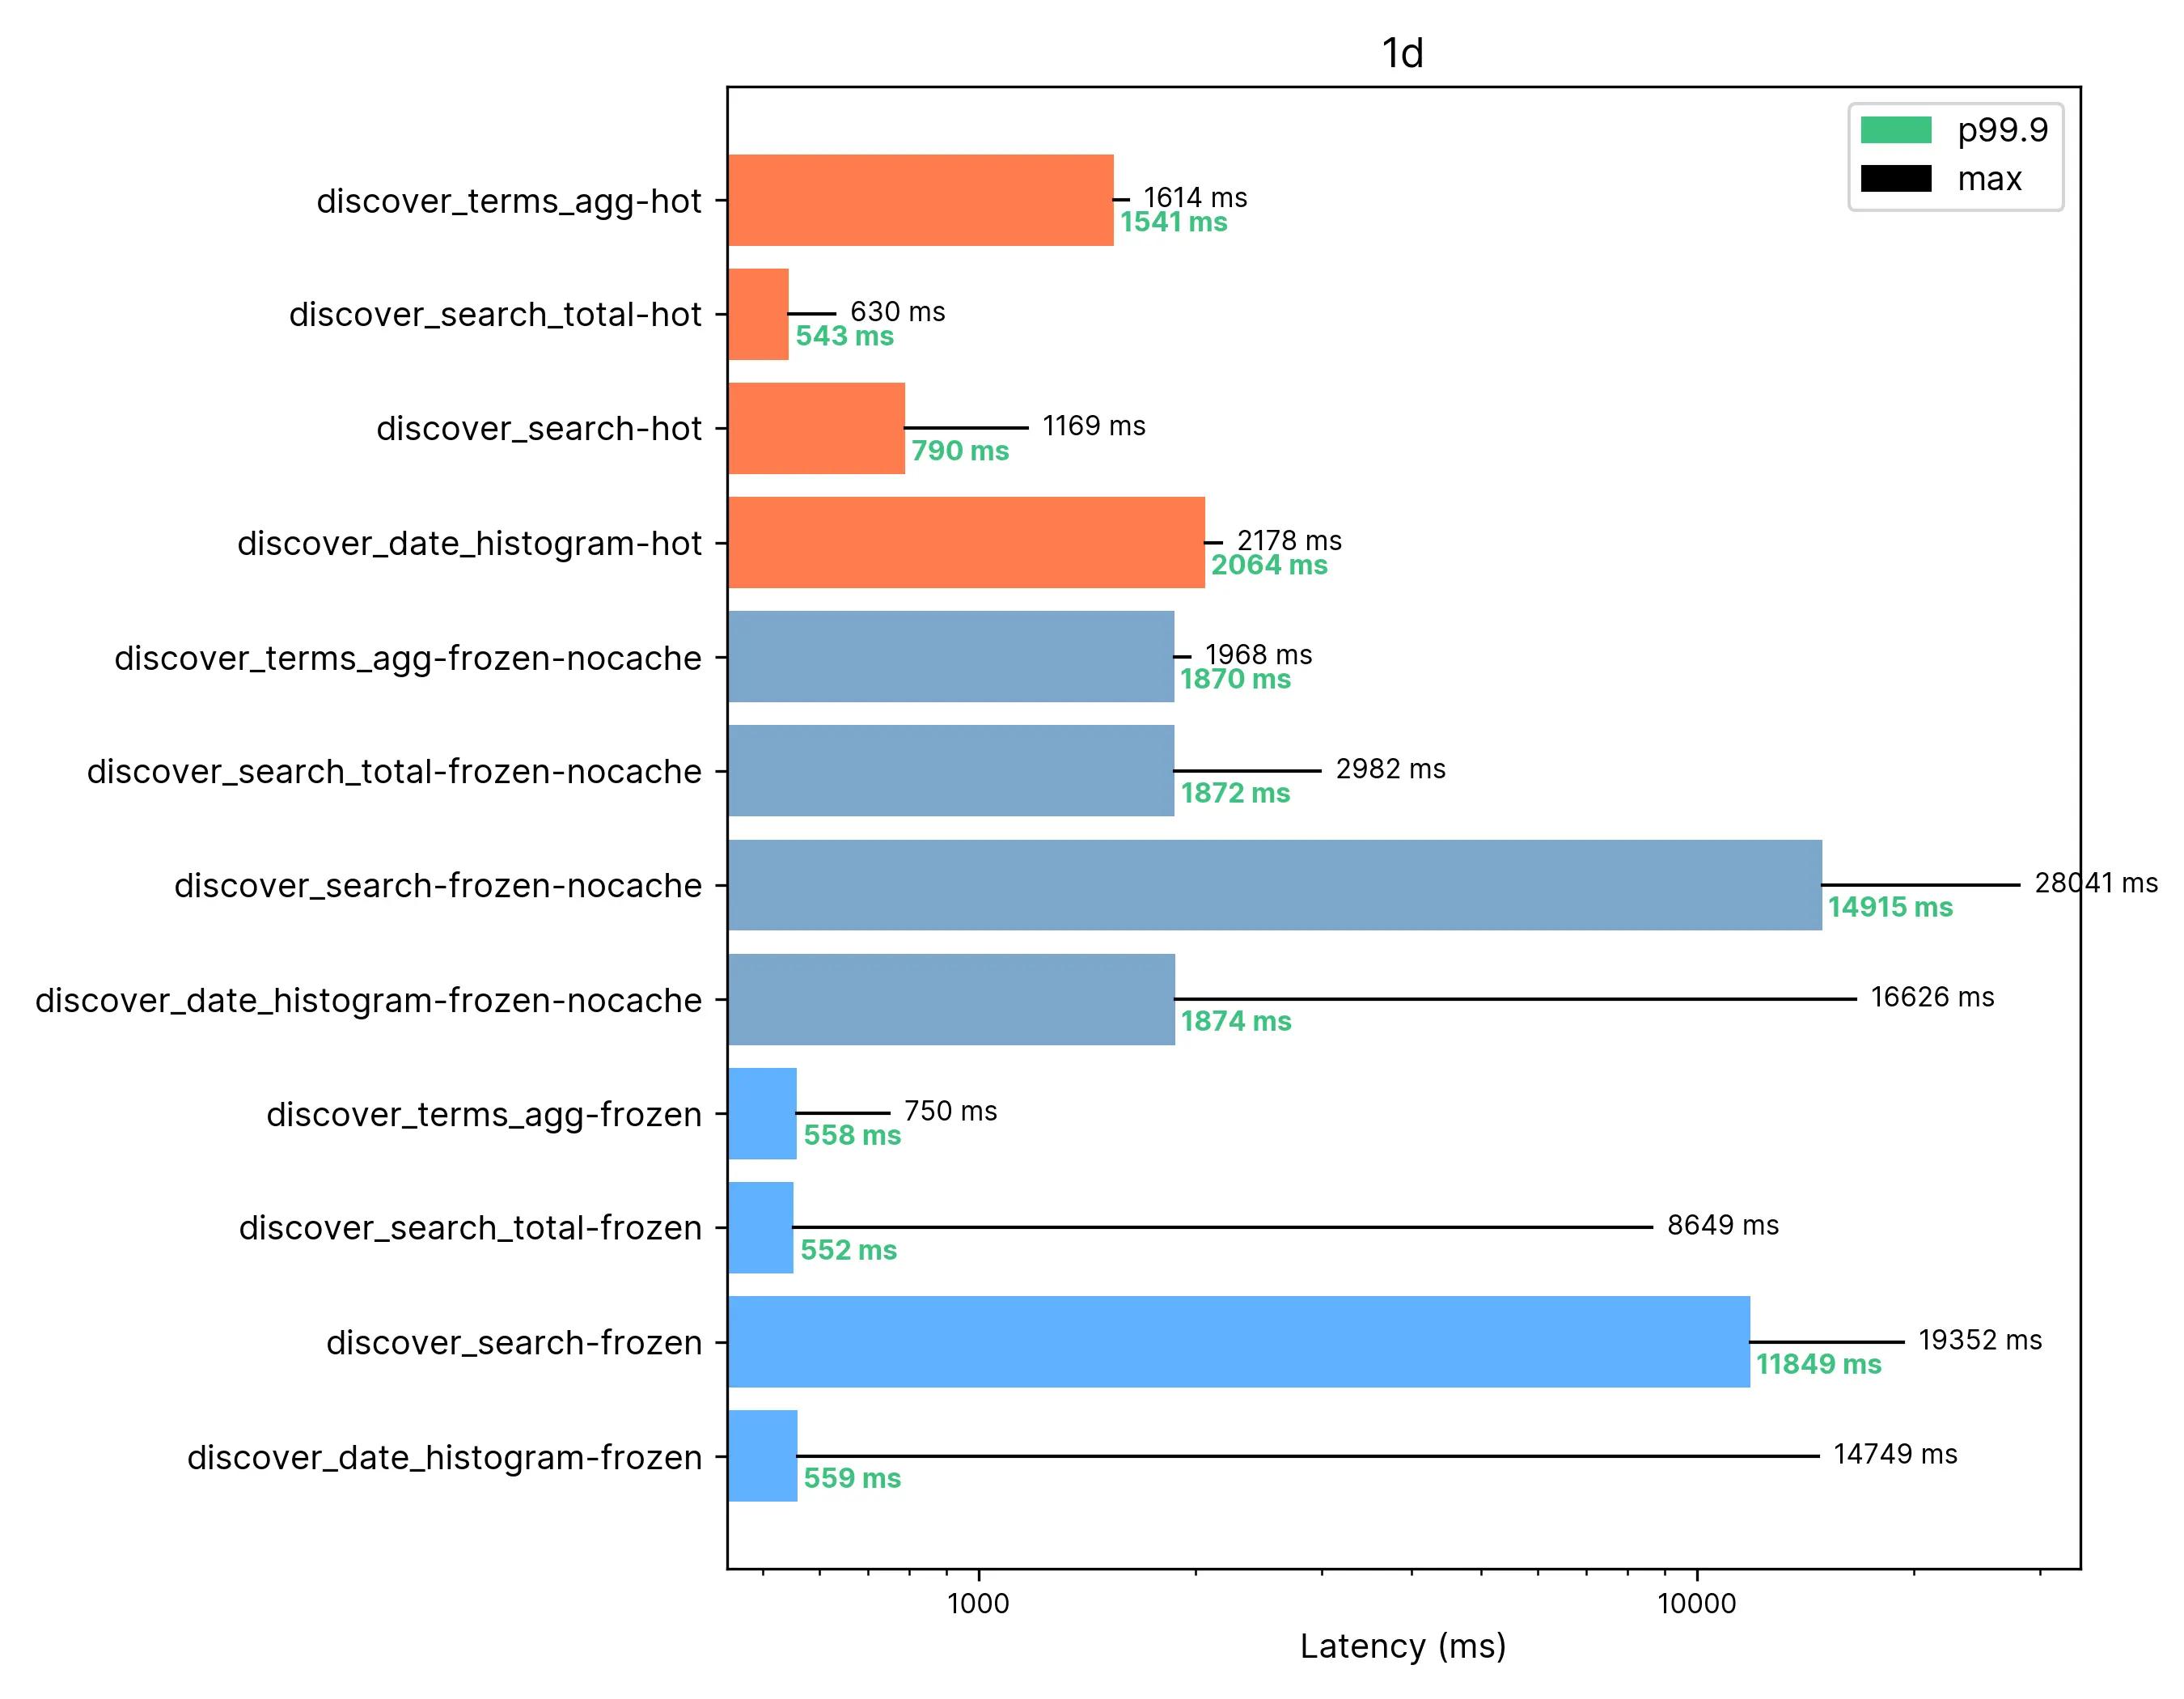
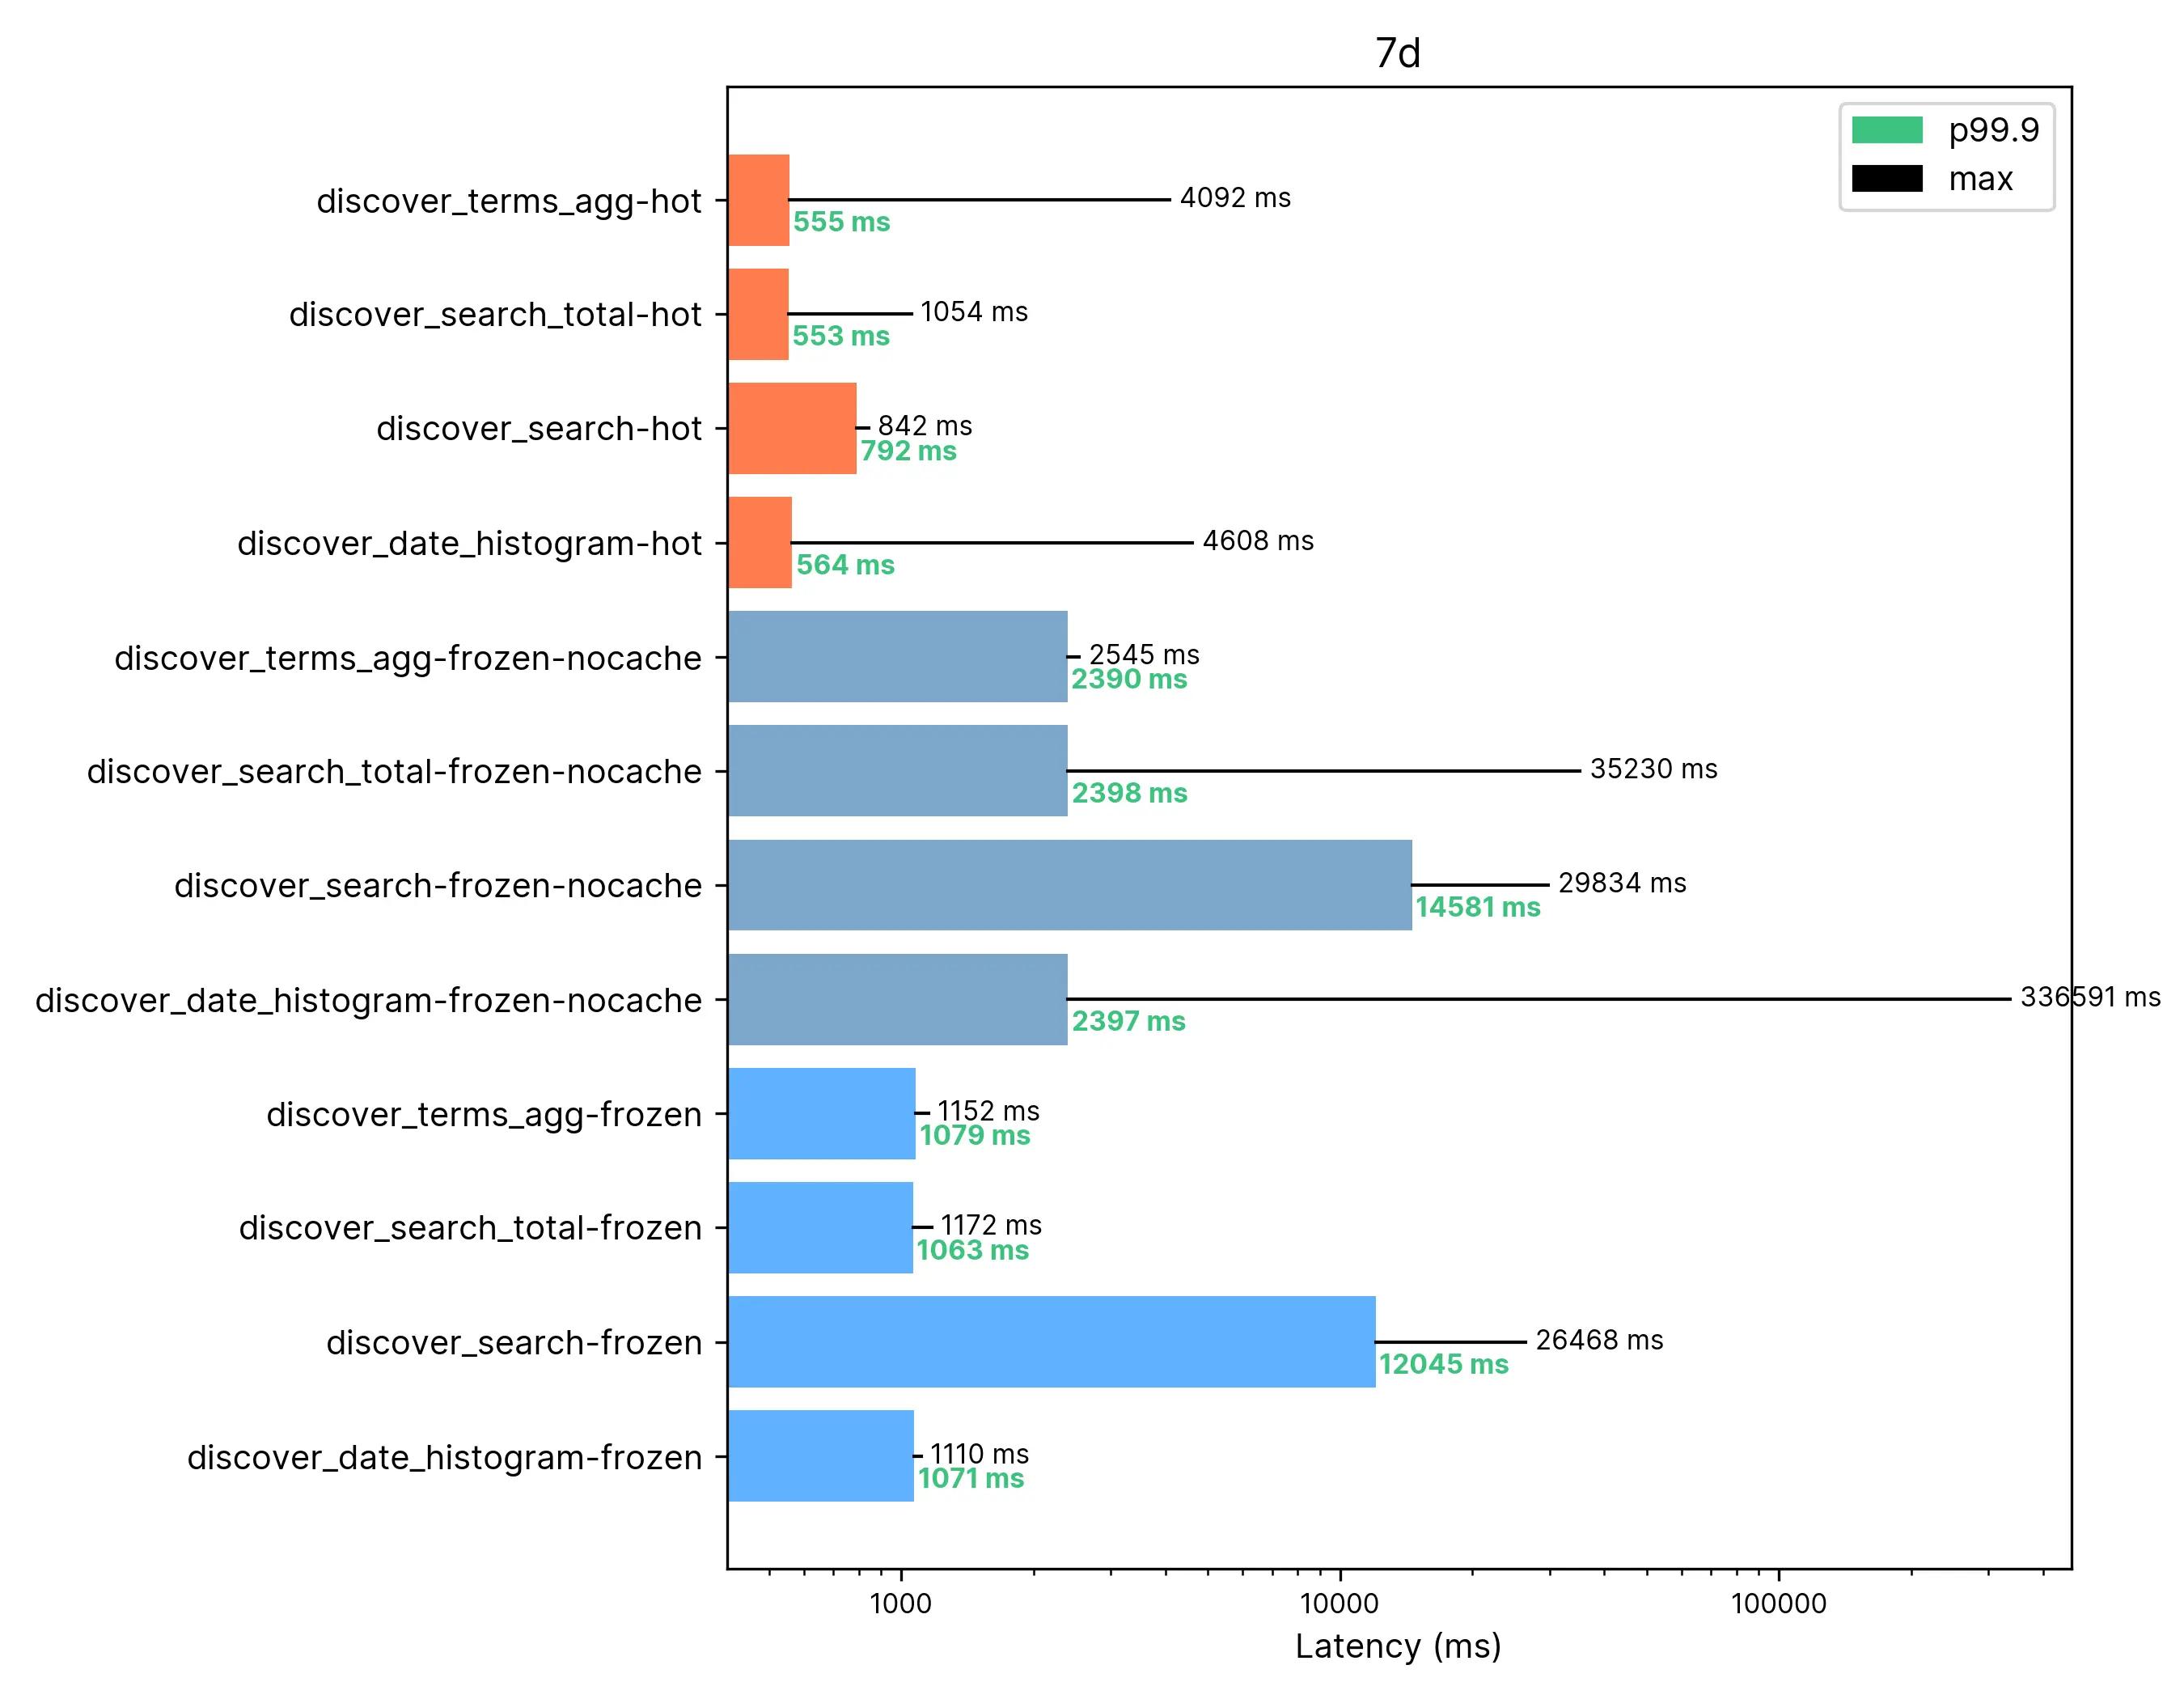
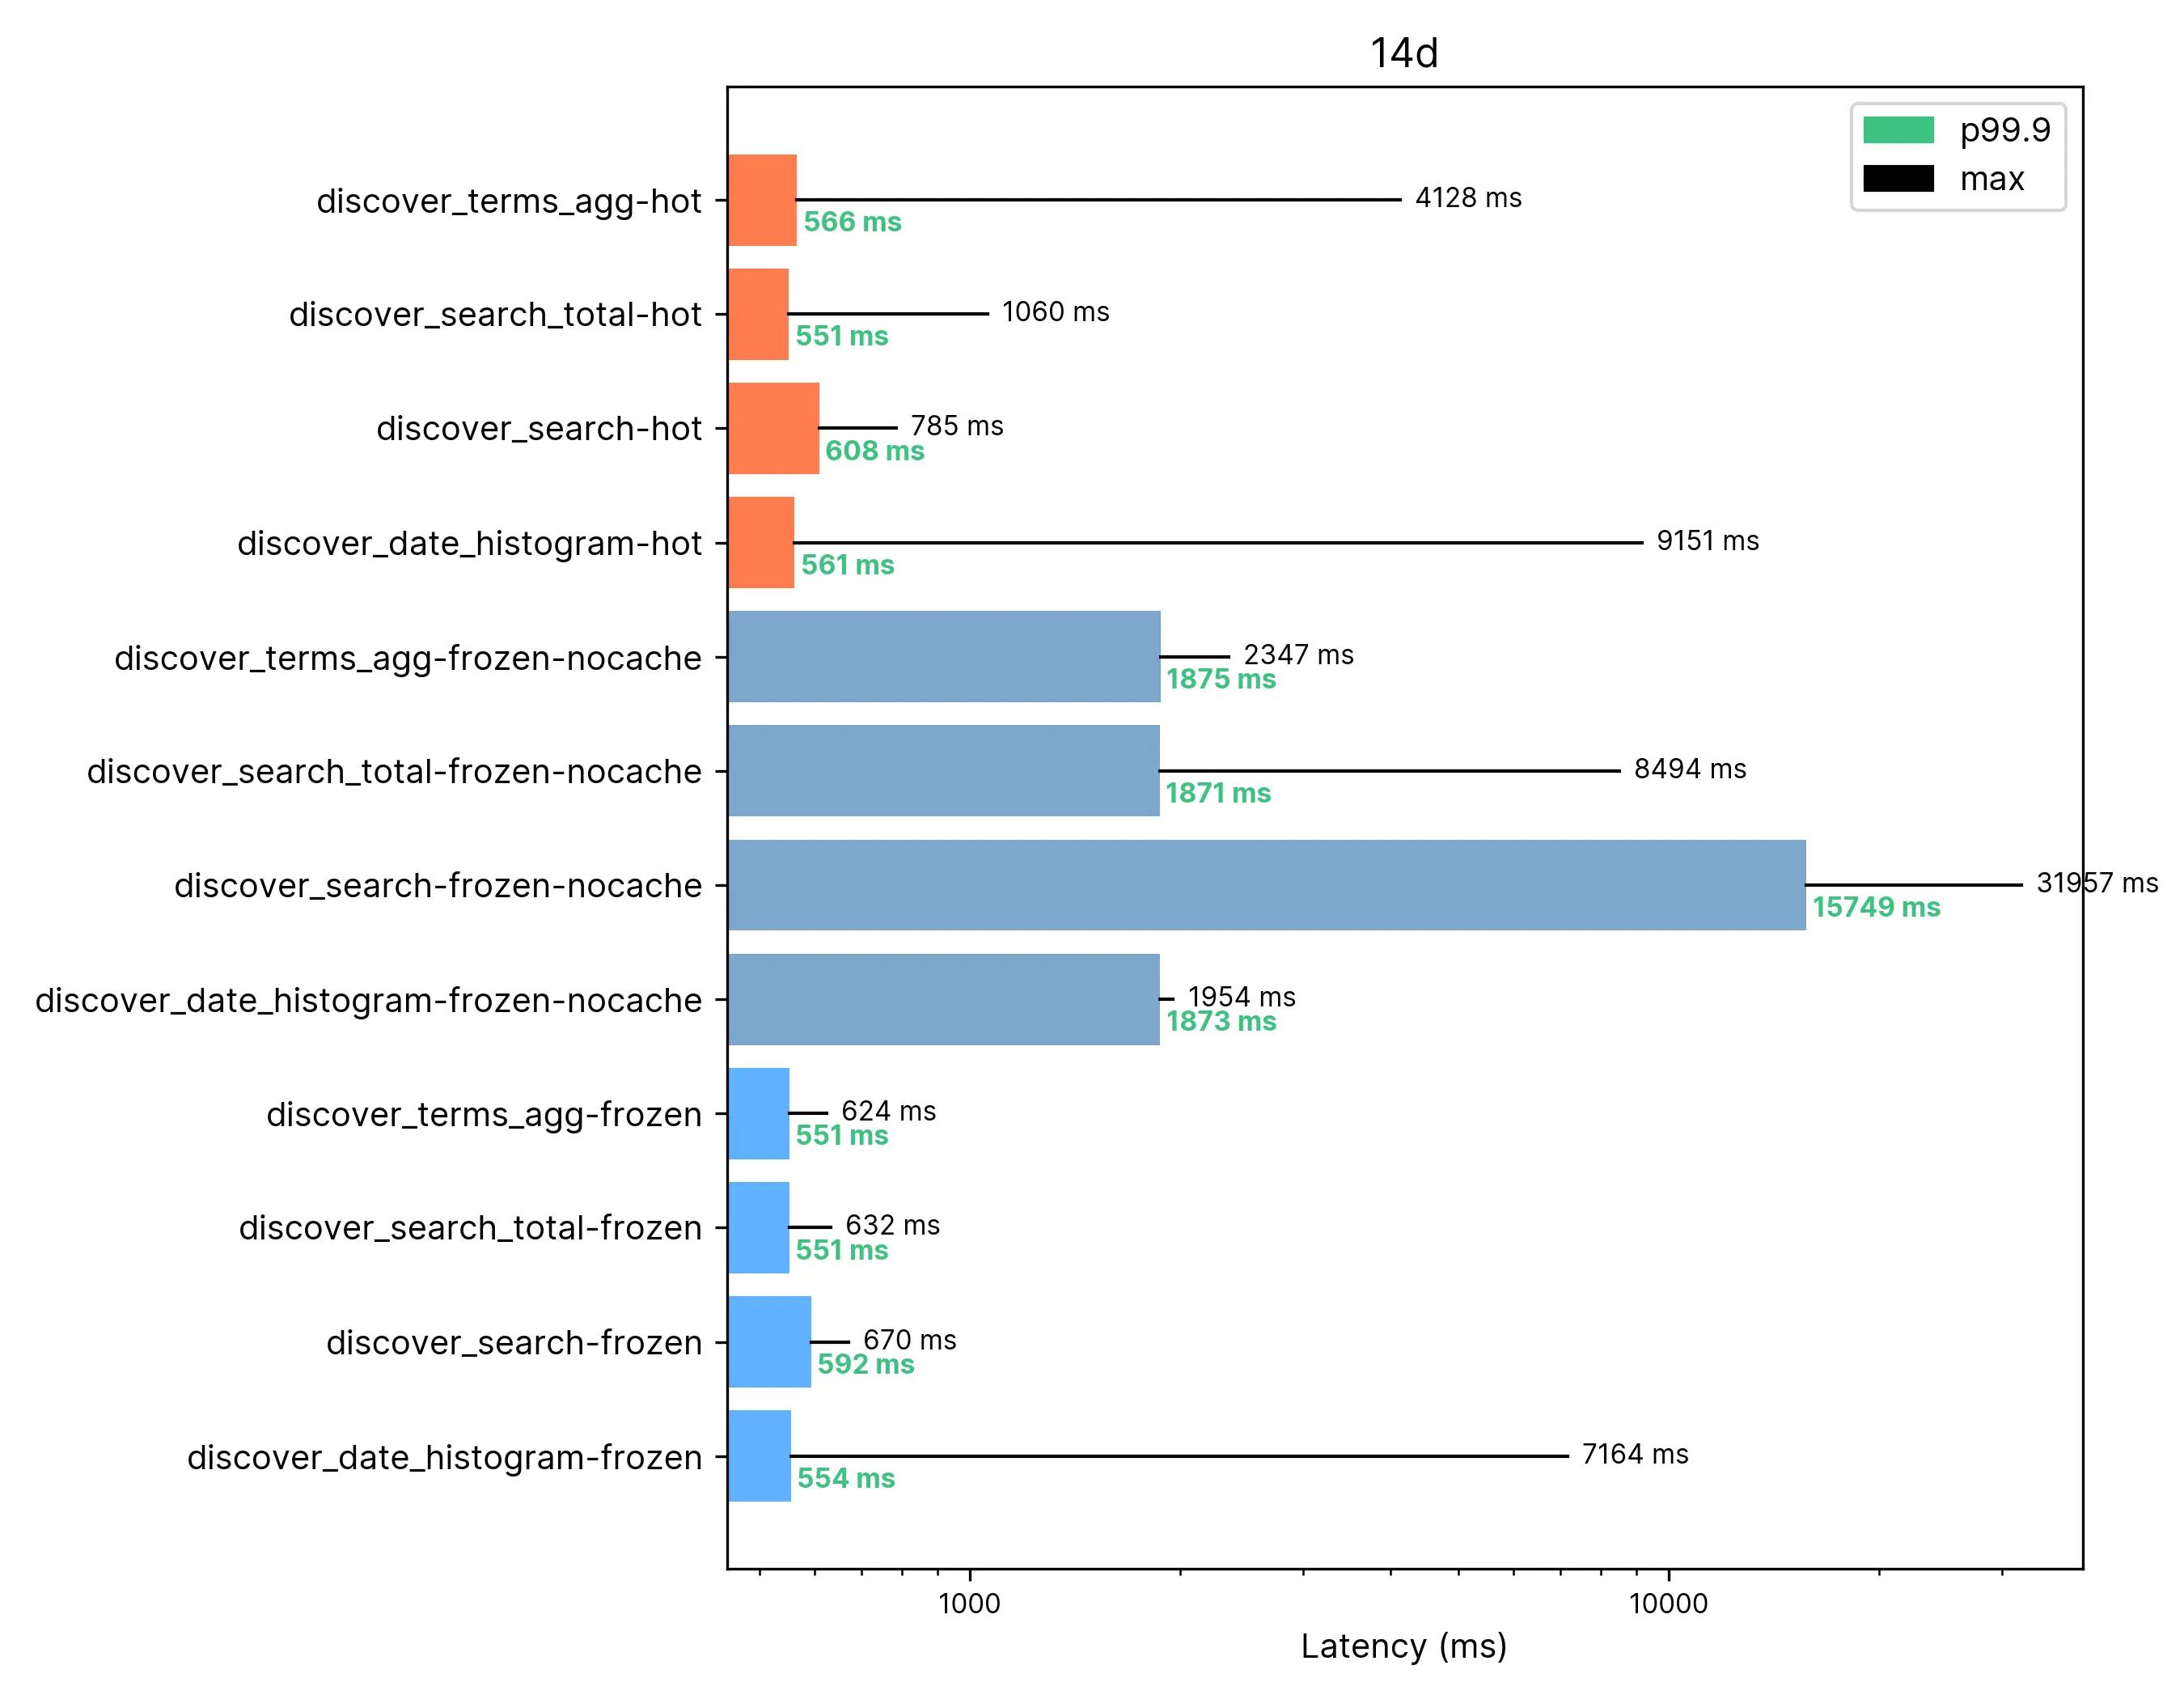
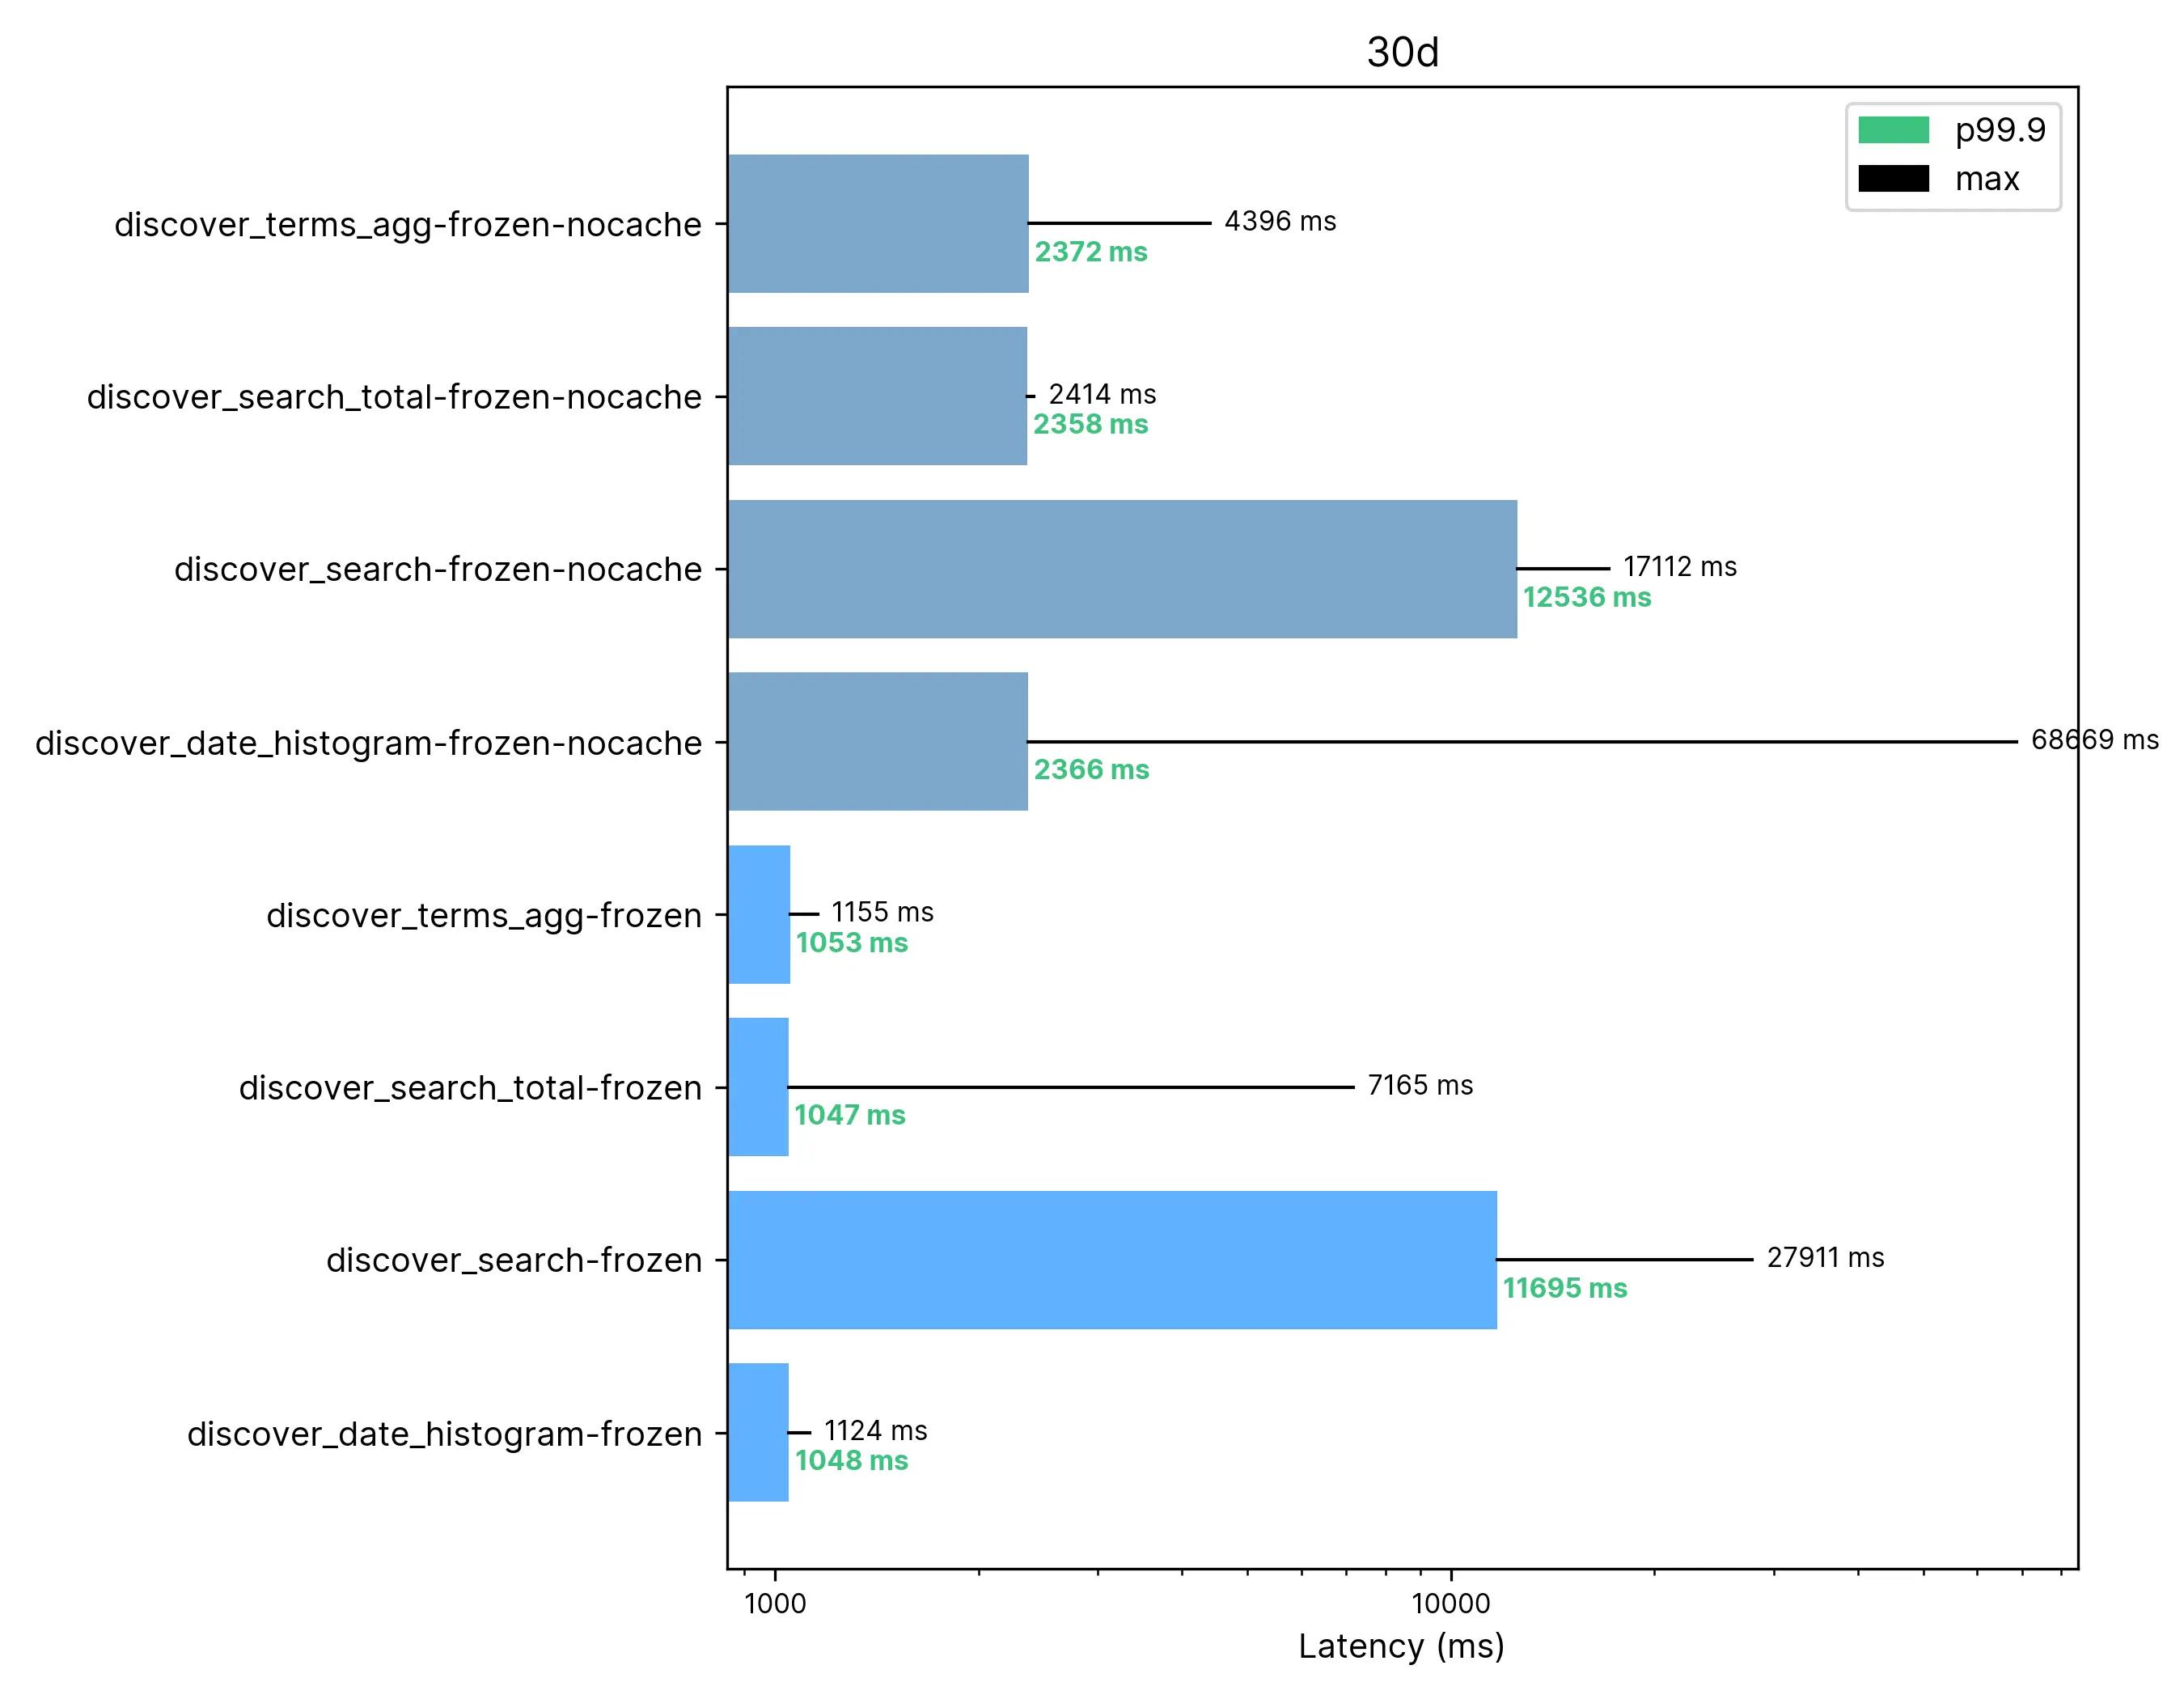
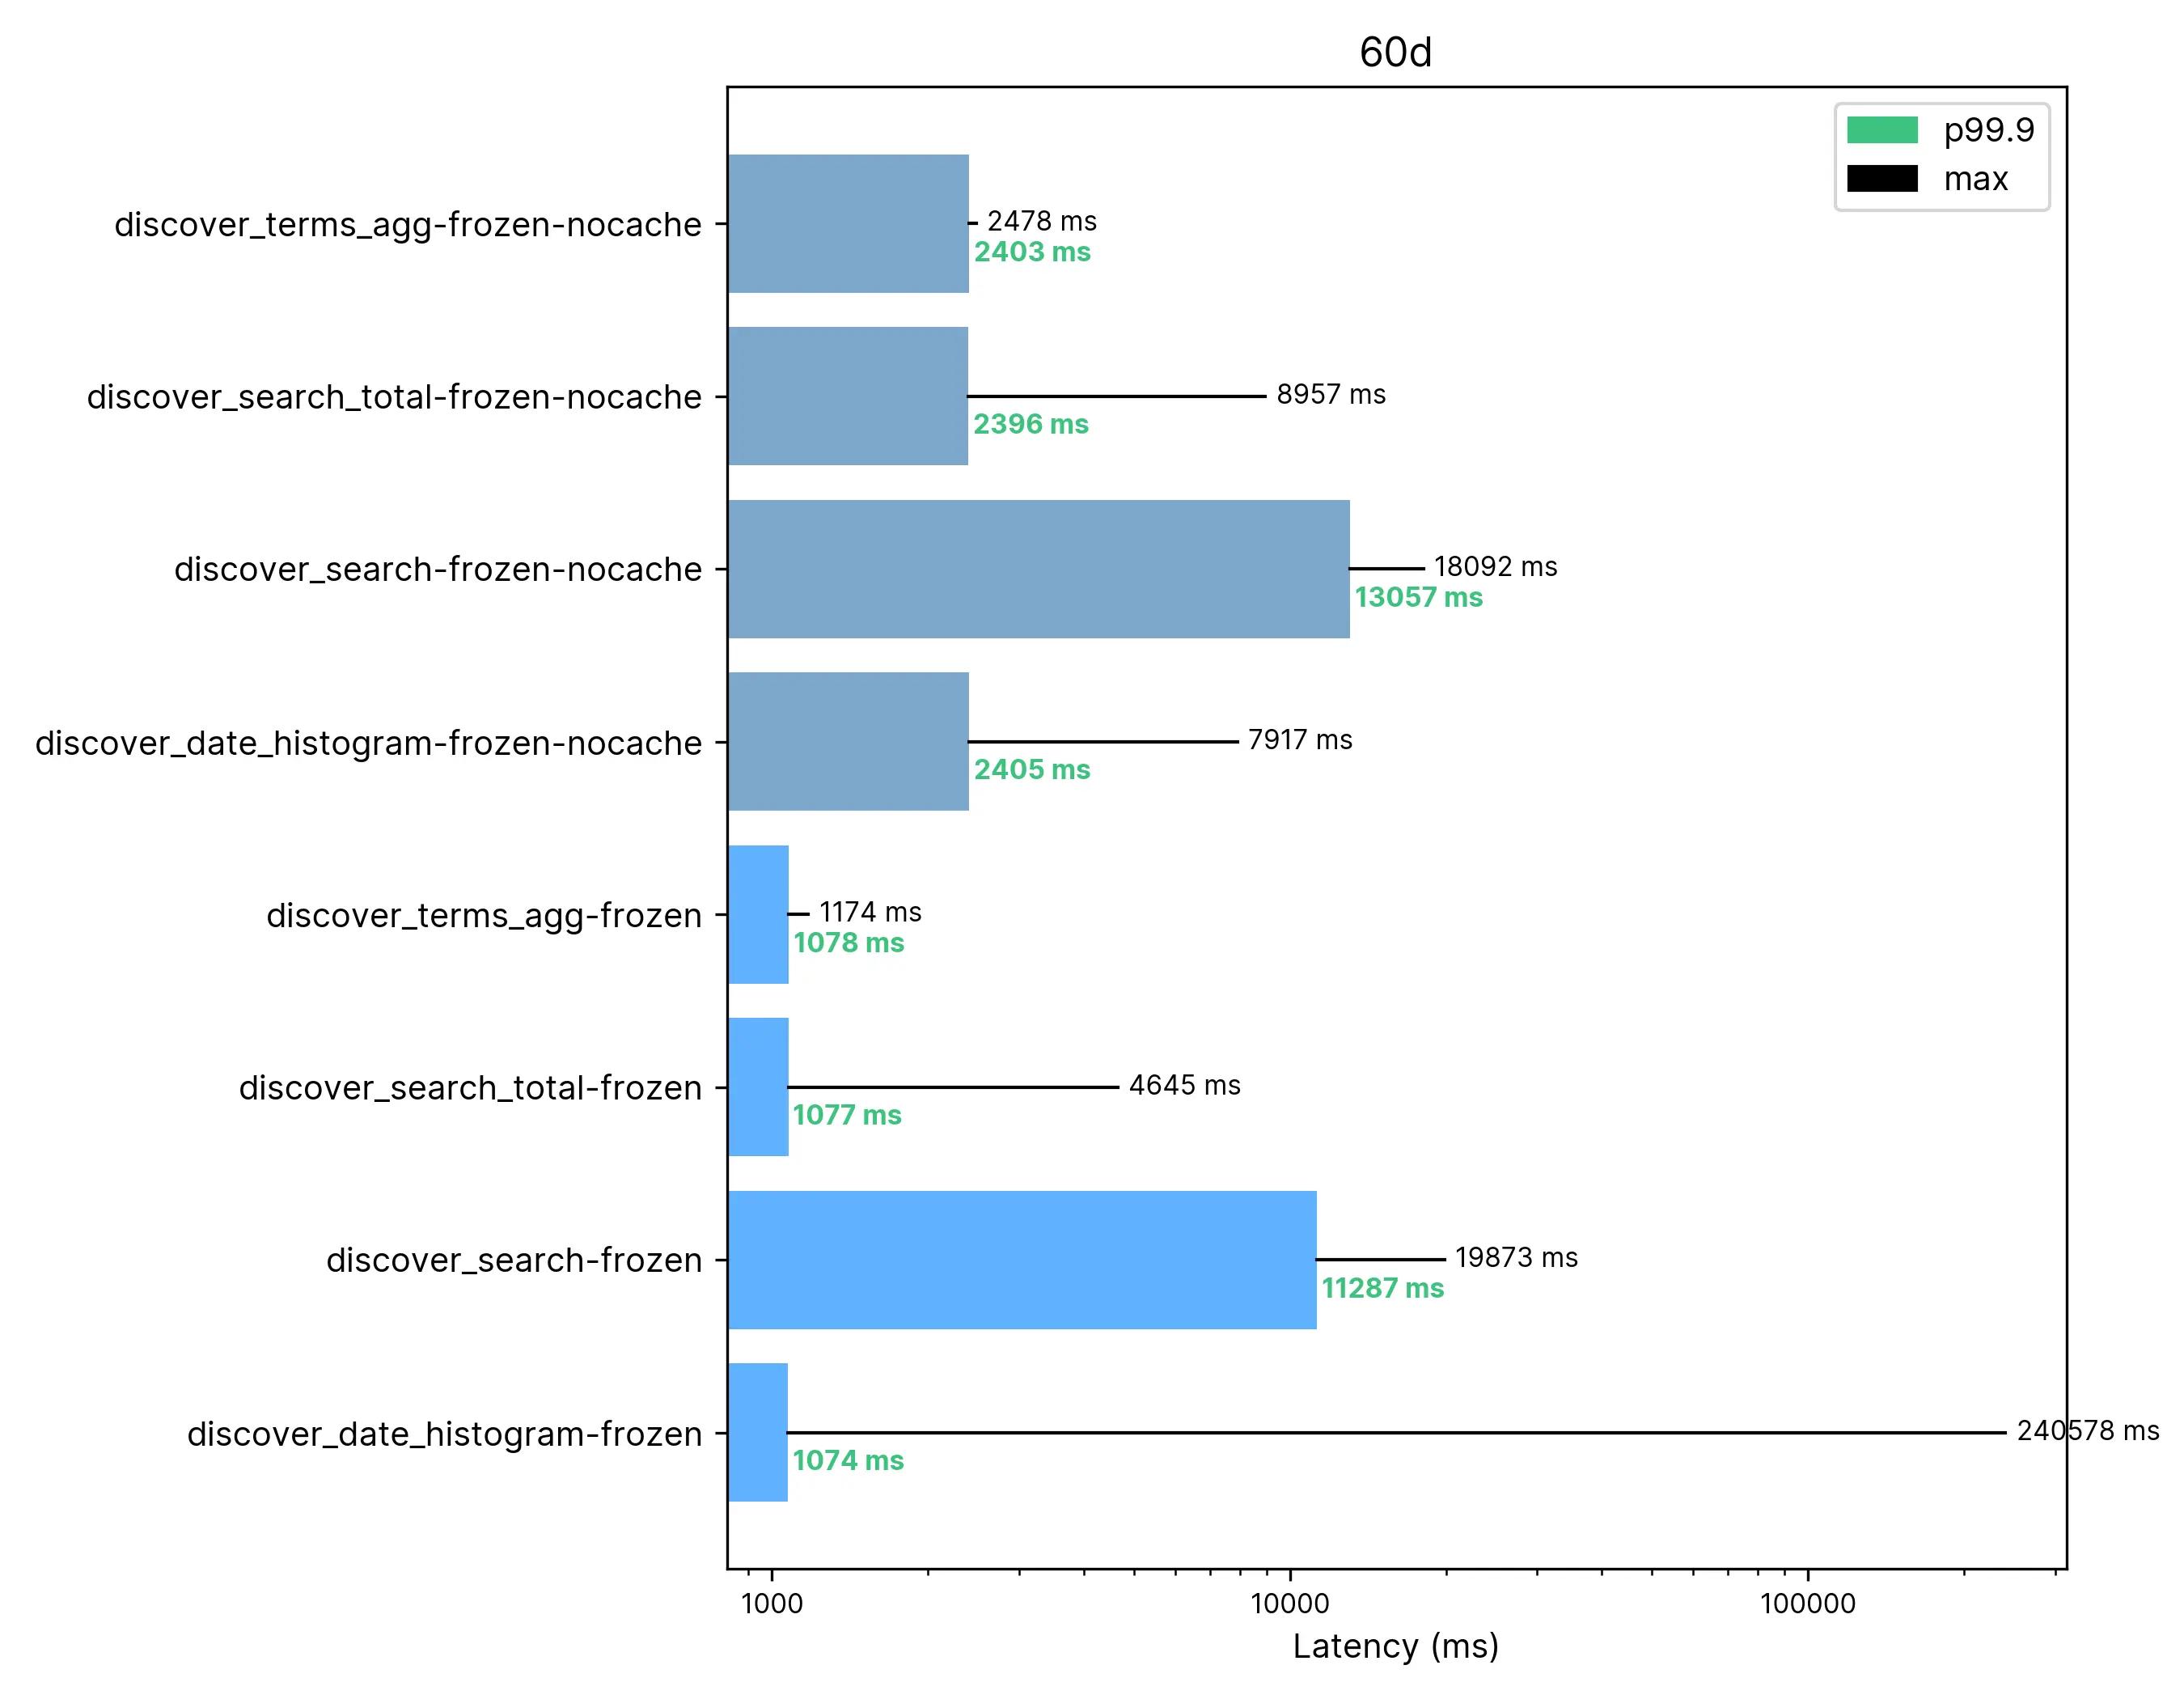
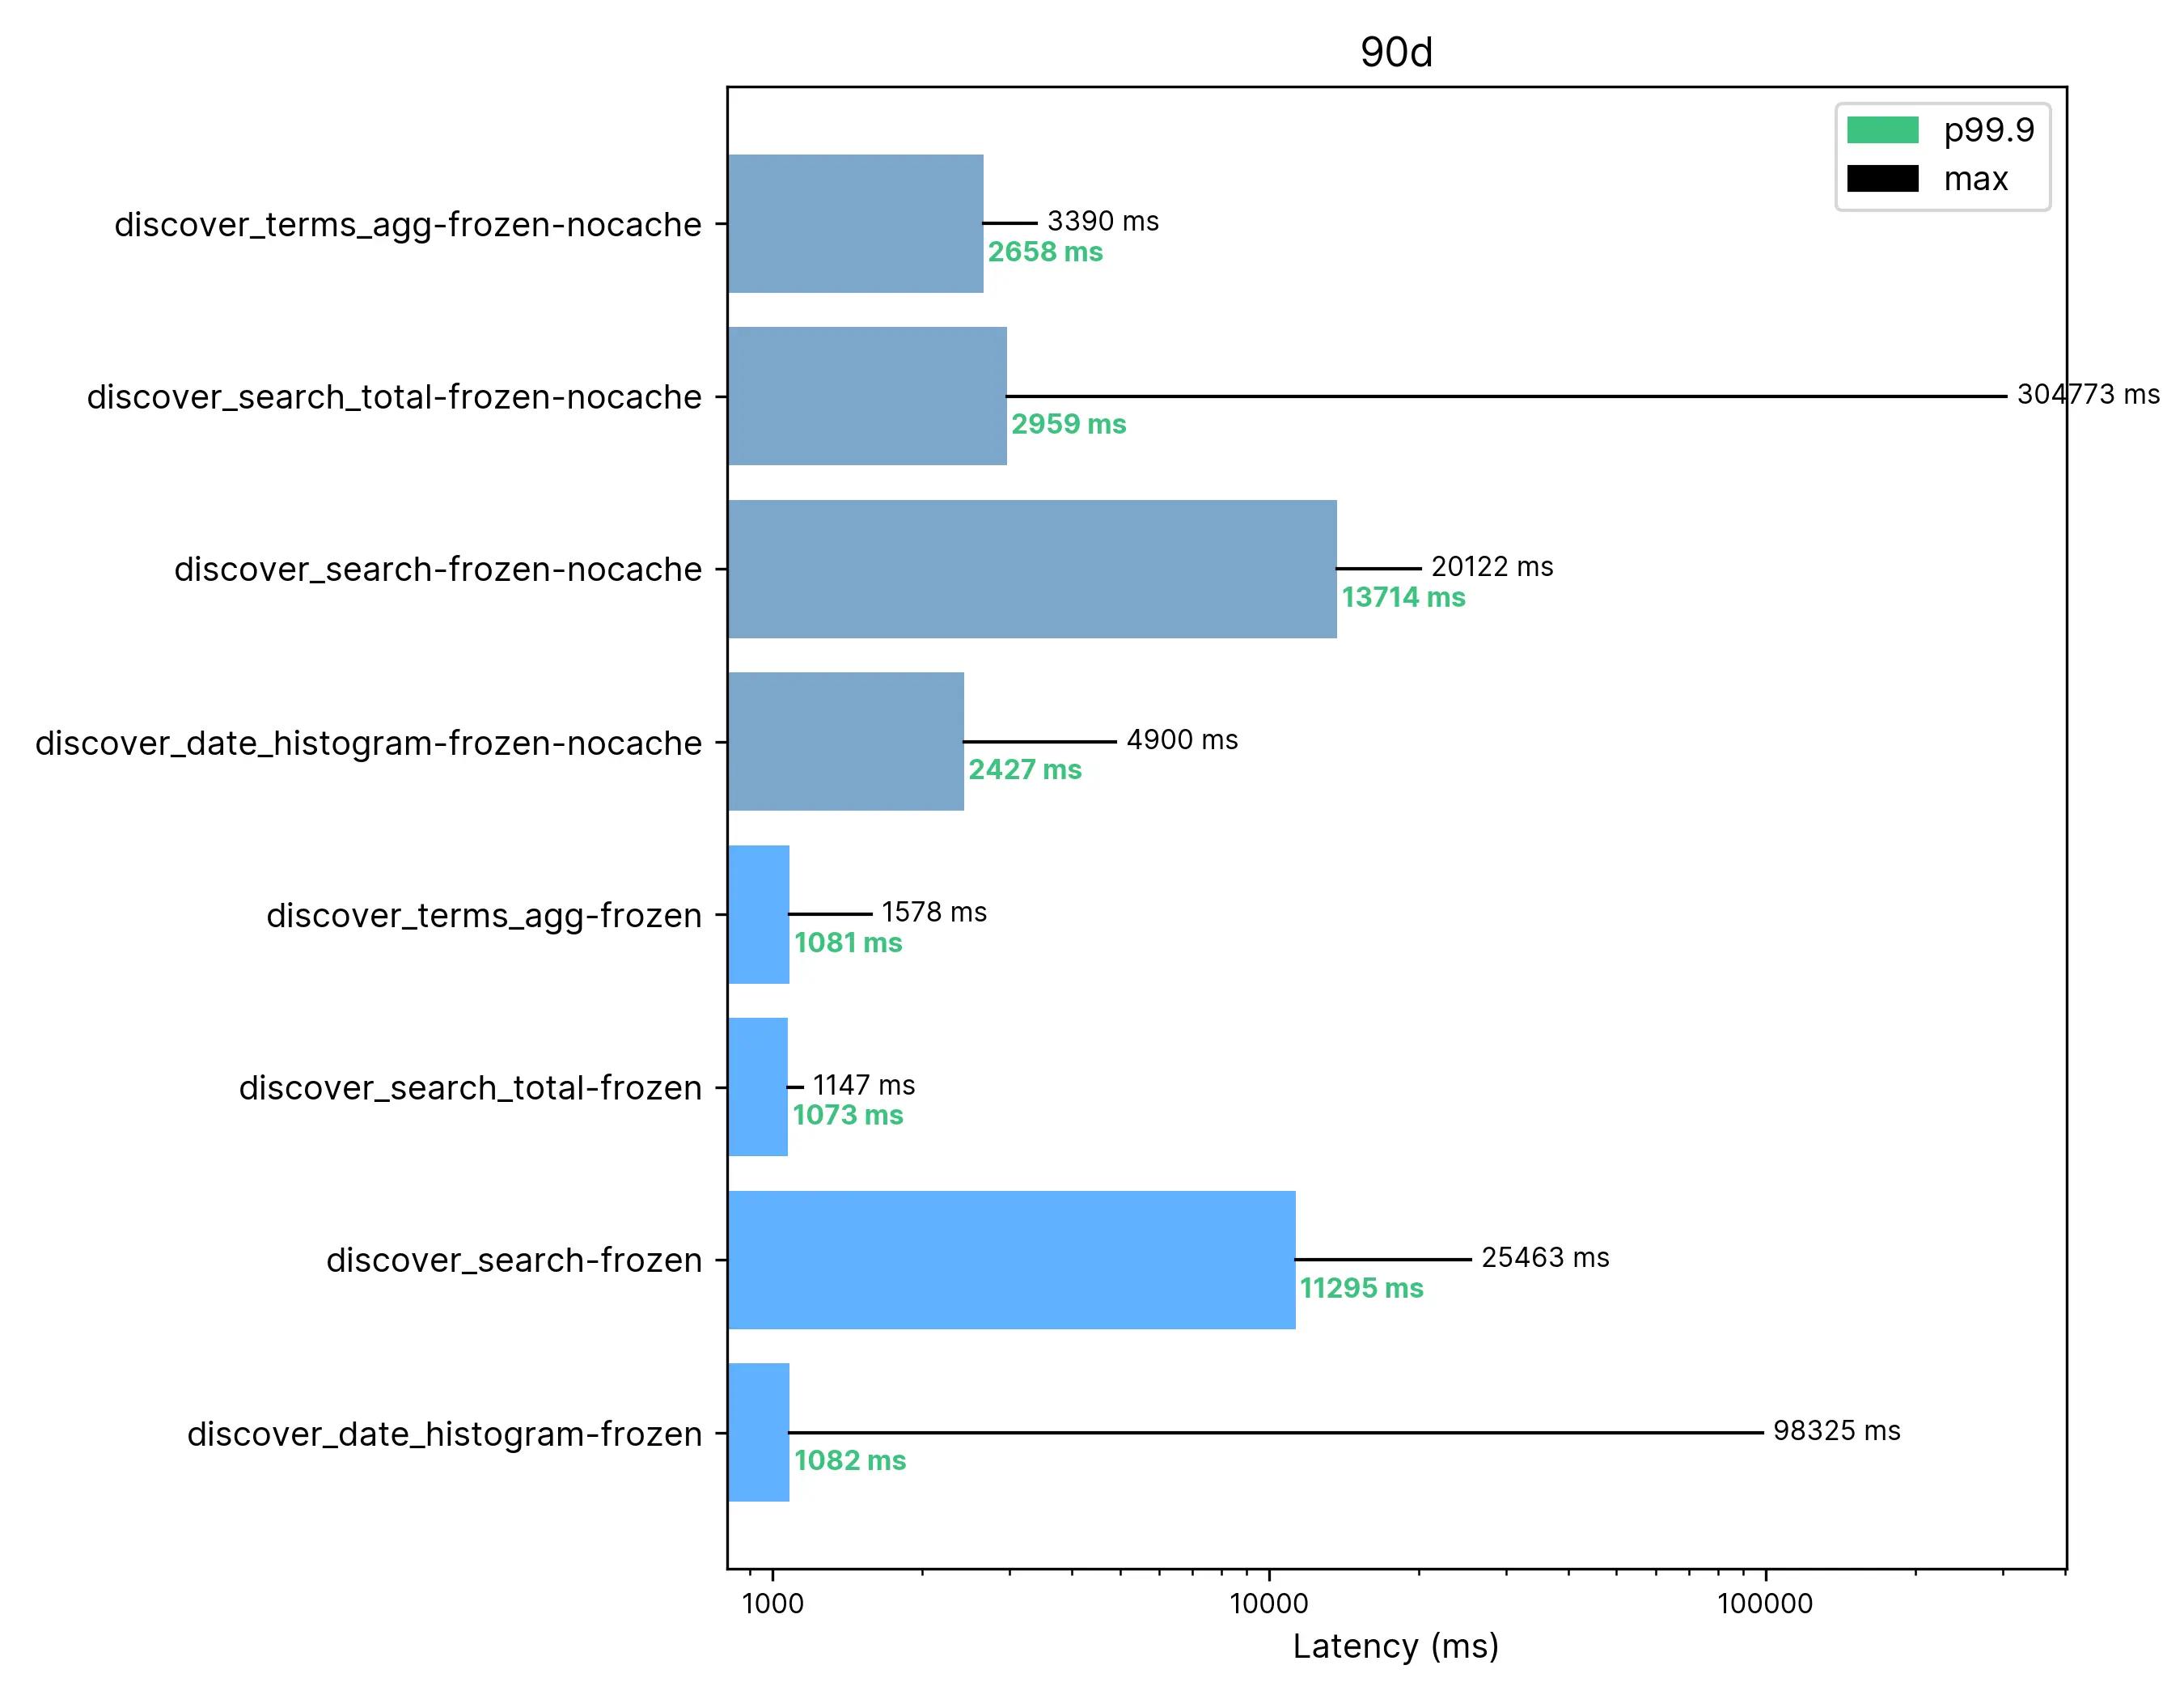
The detailed results are outlined below. The "tip of the candle" represents the max (or p100) value observed within all the requests for a specific operation, and they are grouped by tier. The green value represents the p99.9, or the value below what 99.9% of the requests would fall.
Due to how Kibana interacts with Elasticsearch–which is via async searches–a more logical way of representing the time is by using horizontal bar charts as below. Since the requests are asynchronous and parallel, they will complete at different times. You don't have to wait for all of them to start seeing query results, and this is how we read the benchmark results.

The results are expressed as, for example, 543ms - 2s where 543ms is when we received the first result and 2s when we received the last.
1 Day Span / 1 Terabyte
What we observed 99.9% of the times (p99.9):
- Hot: 543ms - 2s
- Frozen Not Cached: 1.8s - 14s
- Frozen Cached: 558ms - 11s
What we observed as a maximum latency (likely the very first query):
- Hot: 630ms - 2s
- Frozen Not Cached: 1.9s - 28s
- Frozen Cached: 750ms - 19s
7 Days Span / 7 Terabytes
What we observed 99.9% of the times (p99.9):
- Hot: 555ms - 792s
- Frozen Not Cached: 2.5s - 14s
- Frozen Cached: 1s - 12s
What we observed as a maximum latency (likely the very first query):
- Hot: 842ms - 4s
- Frozen Not Cached: 2.5s - 5.6m (336s)
- Frozen Cached: 1.1s - 26s
14 Days Span / 14 Terabytes
What we observed 99.9% of the times (p99.9):
- Hot: 551ms - 608ms
- Frozen Not Cached: 1.8s - 15s
- Frozen Cached: 551ms - 592ms
What we observed as a maximum latency (likely the very first query):
- Hot: 785ms - 9s
- Frozen Not Cached: 2.3s - 32s
- Frozen Cached: 624ms - 7s
30 Days Span / 30 Terabytes
We did not use hot data past 14 days on this test, but we can still use the results for frozen as a reference.
What we observed 99.9% of the times (p99.9):
- Frozen Not Cached: 2.3s - 12s
- Frozen Cached: 1s - 11s
What we observed as a maximum latency (likely the very first query):
- Frozen Not Cached: 2.4s - 68s
- Frozen Cached: 1.1s - 27s
60 Days Span / 60 Terabytes
What we observed 99.9% of the times (p99.9):
- Frozen Not Cached: 2.3s - 13s
- Frozen Cached: 1s - 11s
What we observed as a maximum latency (likely the very first query):
- Frozen Not Cached: 2.4s - 18s
- Frozen Cached: 1.1s - 240s
90 Days Span / 90 Terabytes
What we observed 99.9% of the times (p99.9):
- Frozen Not Cached: 2.4s - 13s
- Frozen Cached: 1s - 11s
What we observed as a maximum latency (likely the very first query):
- Frozen Not Cached: 3.3s - 5m (304s)
- Frozen Cached: 1.1s - 1.6m (98s)
Cost implications (16x reduction)
Let's make a simple pricing exercise using Elastic Cloud.
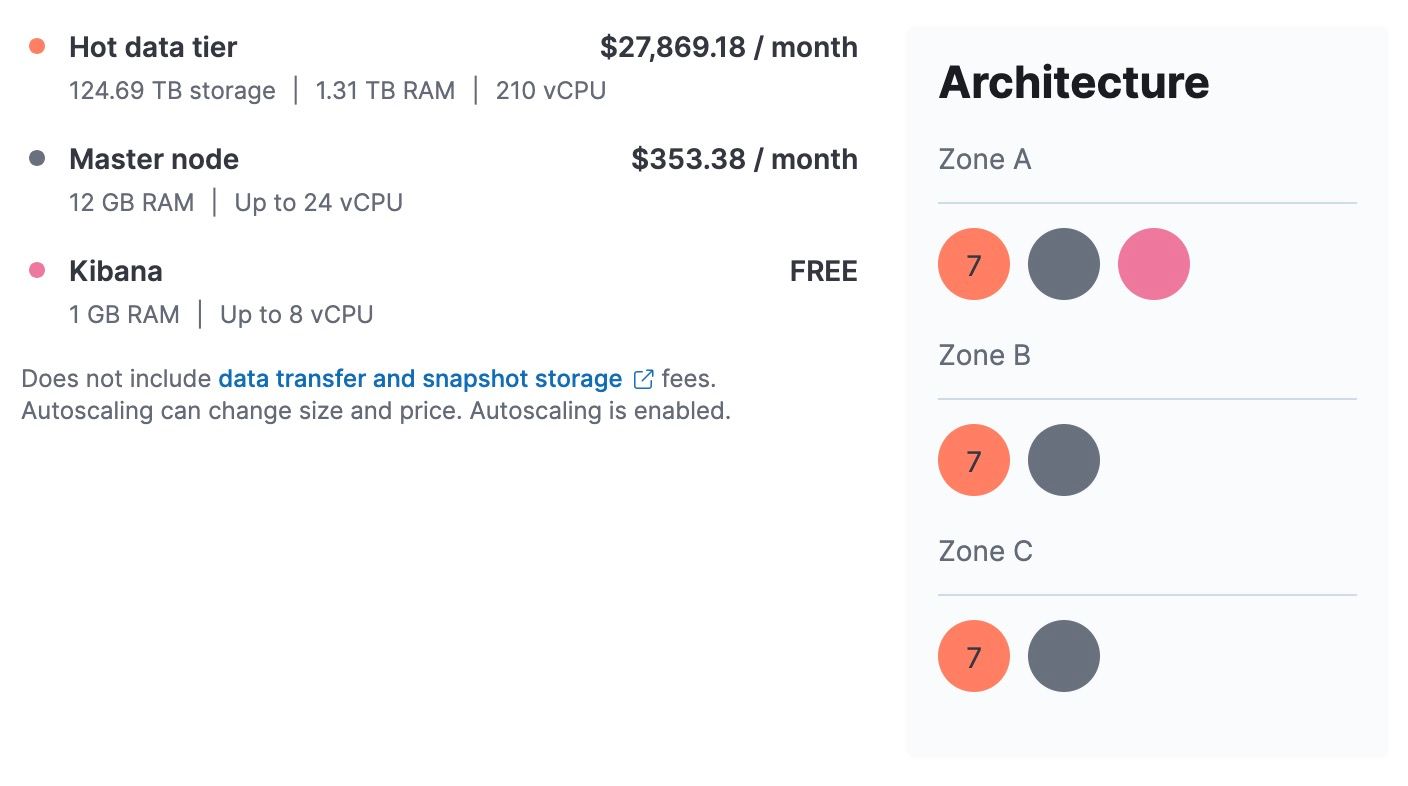
If we were to put the entirety of a 90 days / 90 TB dataset in an all-hot deployment on the most performant hardware profile for large datasets (Storage Optimized), that would cost $53.382 / month since we would need about 45 hot nodes to cover about 120TB.
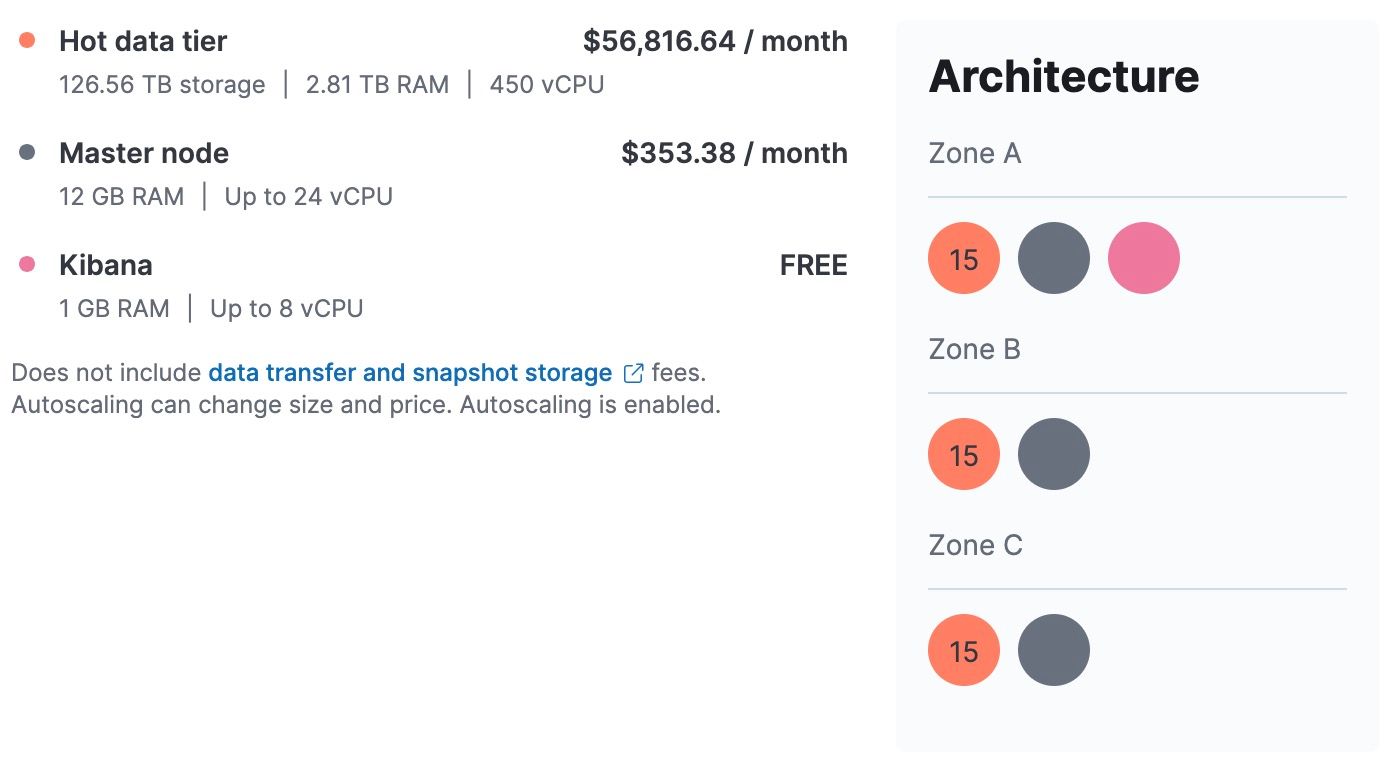
Since Elastic Cloud has different hardware profiles, we could also select Storage optimized (dense), which brings the cost to $28.222.
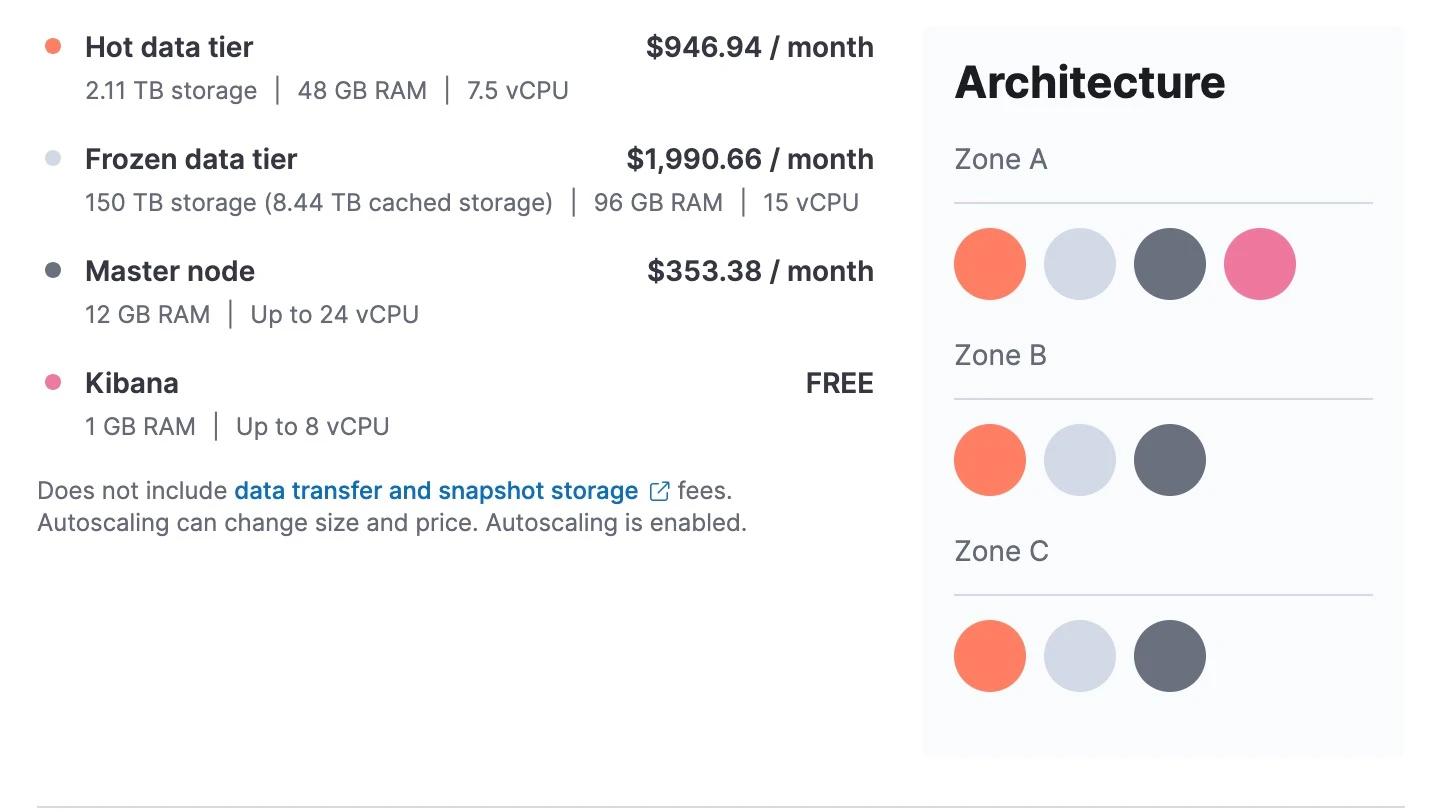
However, by benefiting from the Frozen tier, we could make a deployment that holds 1 day in Hot and the rest on Frozen. The cost of such deployment can be as low as $3.290, a staggering 16x reduction on costs.
Use Elastic's frozen data tier to cool down the cost of data storage
Elastic's frozen data tier redefines what's possible in data storage and retrieval. Benchmark results show that it delivers performance comparable to the hot tier, efficiently handling typical user tasks. While rare instances of slightly higher latency (0.1% of the time) may occur, Elastic's searchable snapshots ensure a robust and cost-effective solution for managing large datasets. Whether you're searching through years of security data for advanced persistent threats or analyzing historical seasonal trends from logs and metrics, searchable snapshots and the frozen tier deliver unmatched value and performance. By adopting the frozen tier, organizations can optimize storage strategies, maintain responsiveness, keep data searchable, and stay within budget.
To learn more, see how to set up hot and frozen data tiers for your Elastic Cloud deployment.
Ready to try this out on your own? Start a free trial.
Want to get Elastic certified? Find out when the next Elasticsearch Engineer training is running!
Related content

October 30, 2025
Context engineering using Mistral Chat completions in Elasticsearch
Learn how to utilize context engineering with Mistral Chat completions in Elasticsearch to ground LLM responses in domain-specific knowledge for accurate outputs.

October 23, 2025
Low-memory benchmarking in DiskBBQ and HNSW BBQ
Benchmarking Elasticsearch latency, indexing speed, and memory usage for DiskBBQ and HNSW BBQ in low-memory environments.

October 23, 2025
Semantic search with GPU inference in Elastic
Learn how Elastic's EIS leverages GPU inference and ELSER to power fast, accurate semantic search.
October 23, 2025
Elastic's Kibana navigation refresh in 9.2 from user feedback
Learn how the Elastic team made it easier to navigate in Kibana 9.2 with an on-hover menu access, a visible menu in collapsed mode, and icon-driven navigation.
October 24, 2025
A new era for Elastic Discover: ES|QL, context & multi-tabs
Learn about the evolution of Elastic's Discover, covering ES|QL integration, context-aware querying, multi-exploration tabs, and the new CRUD experience in 9.2.