Released early November on Elastic Cloud Hosted, AutoOps significantly simplifies cluster management with performance recommendations, resource utilization and cost insights, real-time issue detection and resolution paths.
One of the hundreds of analyses AutoOps runs every minute to check your cluster's settings, metrics, and health alerts when long running search queries are plaguing your cluster. Long running search queries can significantly impact performance, leading to high resource consumption. Let's see how this works concretely.
How does it work?
The beauty of AutoOps for Elastic Cloud Hosted is that there's nothing to do. In all regions where AutoOps is supported, an AutoOps agent is automatically attached to any new or existing deployment, and within minutes, metrics will start shipping, analysis will kick in, and events will be raised as soon as something fishy is detected.
There's no need to enable slow logs and set up Filebeat to tail and index them somewhere, it just works out of the box by carefully and regularly monitoring the Task Management API.
In order to know if AutoOps is enabled for a given deployment, one can simply head over to his Elastic Cloud console page and click on “Manage” deployment. If the “Open AutoOps” button appears at the top-right of the screen, then AutoOps is enabled.

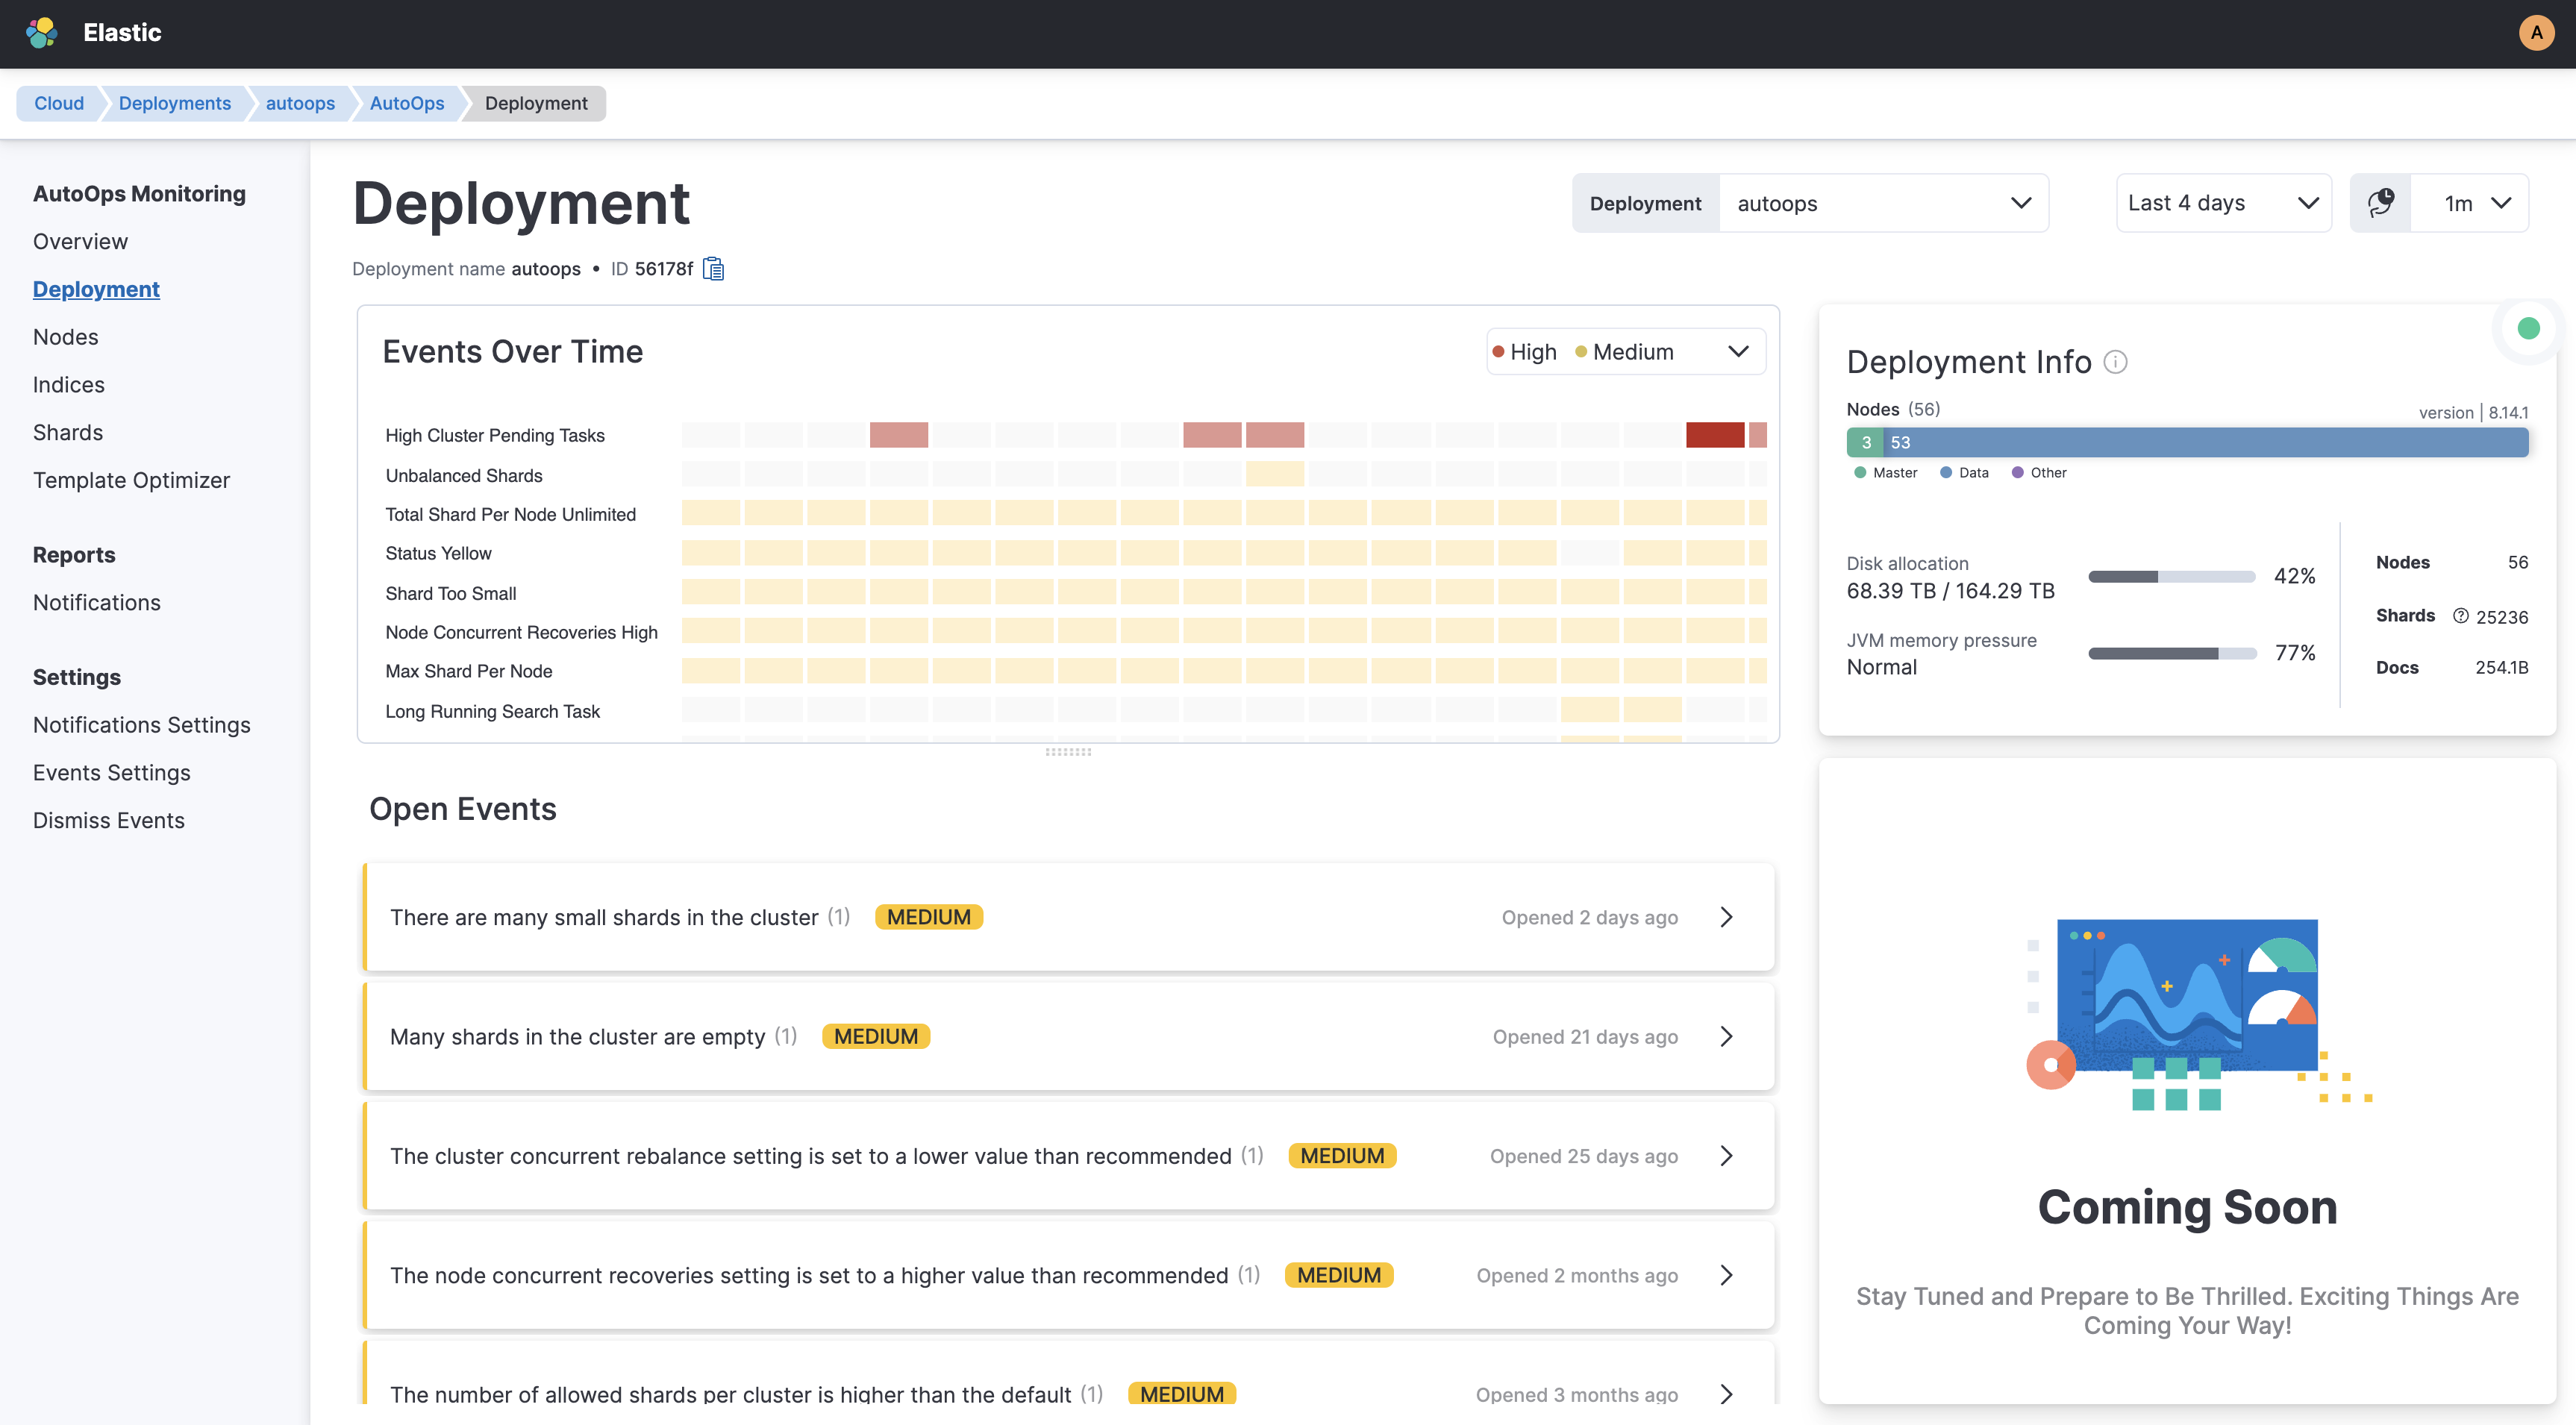
When opening the Deployment view in AutoOps, we're immediately presented with a quick history of all the recent events. In the screenshot below, we can see that a "Long running search task" event was opened recently.
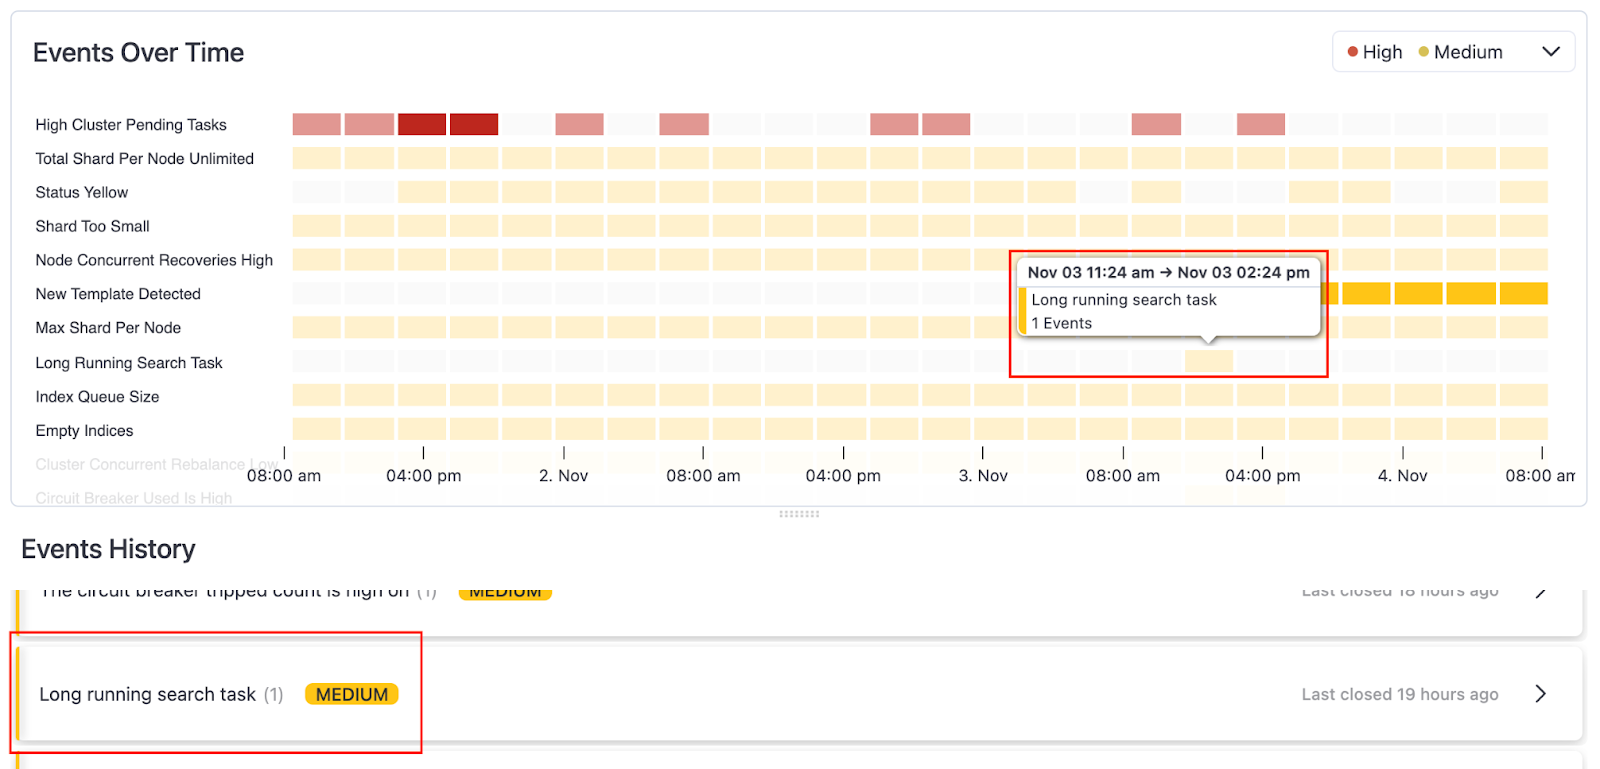
Clicking on the event opens up a fly out panel showing the DSL of the slow search query that has been detected along with a whole bunch of information related to the execution context of that query.
Understanding long running search tasks
The screenshot below shows all the information that AutoOps was able to gather and display in the event fly out panel. We’ll now review each part in more detail.
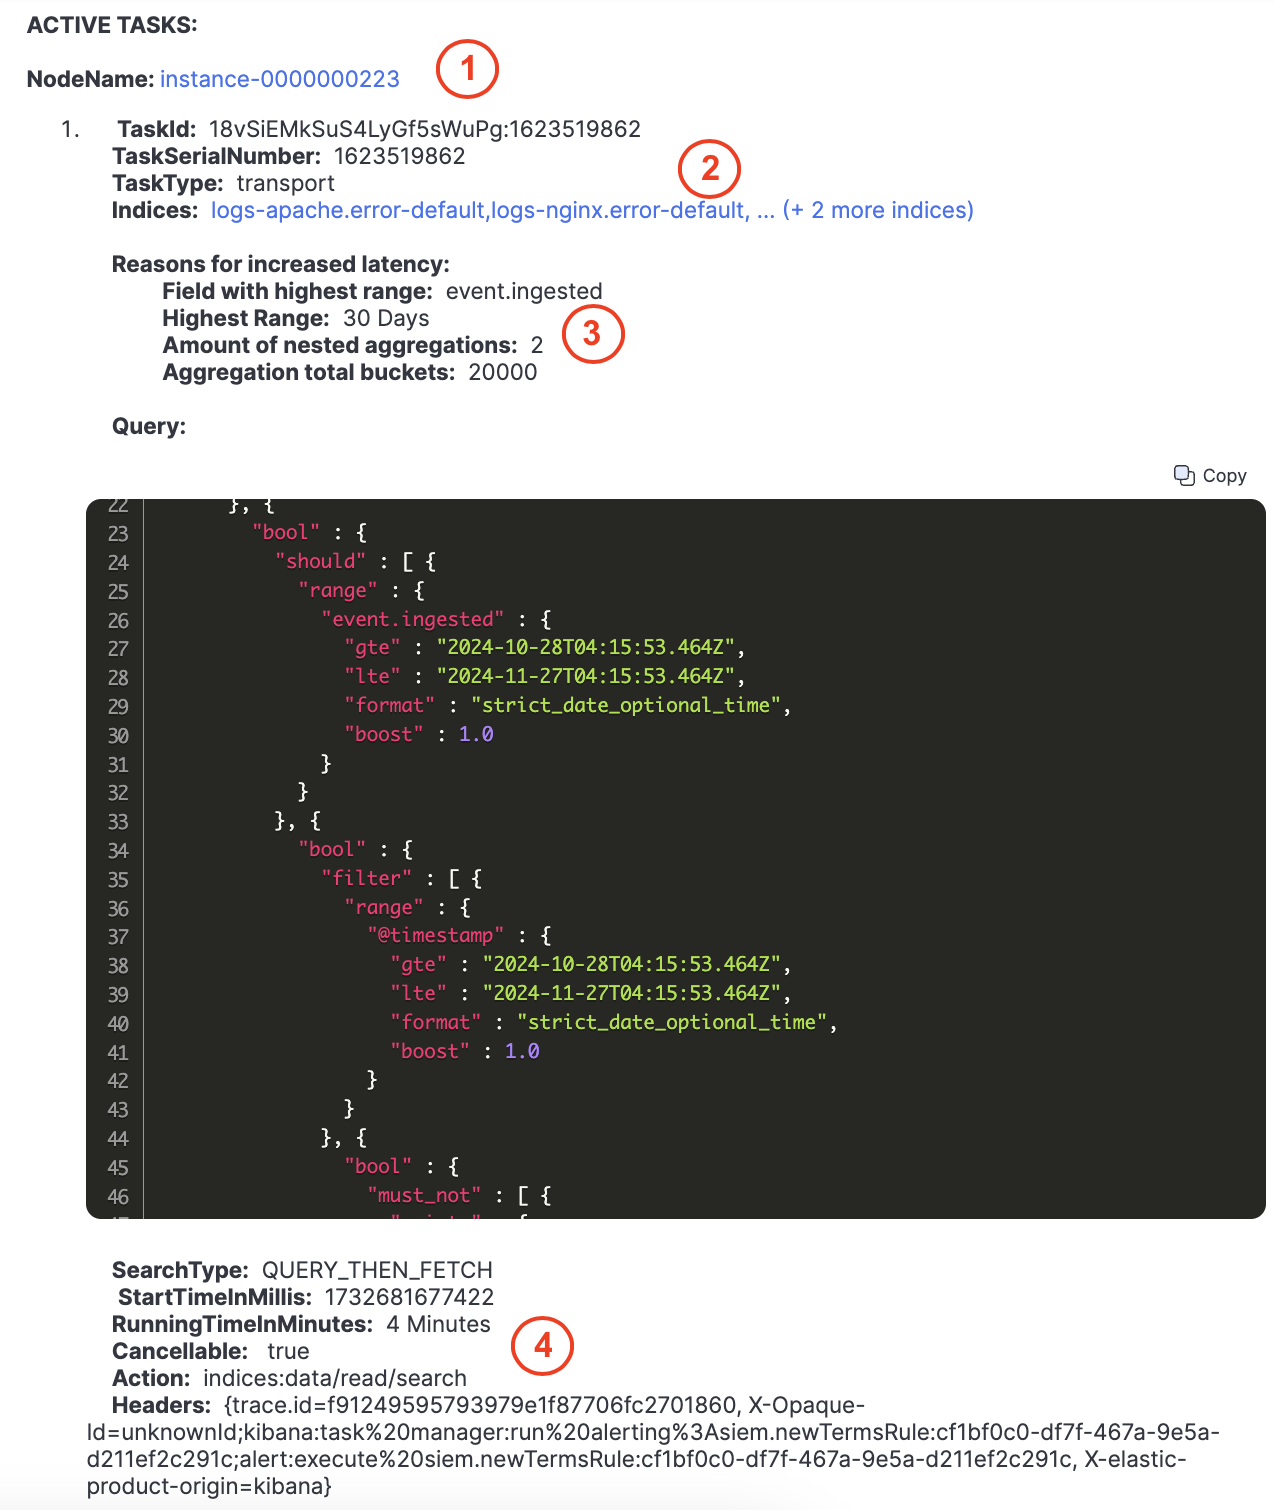
1. The involved node
First, we get a link to the node where the long-running query was detected, i.e. instance-0000000223. That link allows us to jump directly to the Nodes view where we can find a wealth of metrics and information about that specific node.
2. The involved indices
We can also see which indices the query was being run on. In the present case, we can see that the query ran on logs-apache.error-default, logs-nginx.error-default and two more indices.
Clicking on those indices will send us to the Shards view which will allow us to see the detailed shards breakdown of those indices on the identified node as well as all the shards of other indices also located on that node. That view will help us detect if there are any hotspots that might be responsible for causing the slow query.
3. Potential reasons for high query latency
Digging deeper, we can then see that some basic query analysis took place and AutoOps surfaced a few potential reasons why the query might be slow. In this case, we can see that:
- the query ran on a 30 days time interval, which might represent a big volume of data
- there are nested aggregations, which are known to perform poorly
- the response might potentially contain up to 20'000 aggregation buckets, which might be taxing on node memory
There are more detection rules for queries that use regular expressions or scripts. Moreover, new detection rules will be added regularly and also put into perspective with the index mappings.
4. The query context
Finally, there's some more information to glean about the context of the search query, such as:
- for how long it has been running,
- whether it is cancellable or not,
- all the headers that were attached to the HTTP call. In this case, we can see the
trace.idheader (which makes it easy to find it in APM), but alsoX-Opaque-Idthat contains an indication of the client that sent this query. Here, we can see that the query originated from a SIEM alerting rule in Kibana, but it could also be a visualization or a dashboard, or even a user running the query in Dev Tools.
Also works for ES|QL
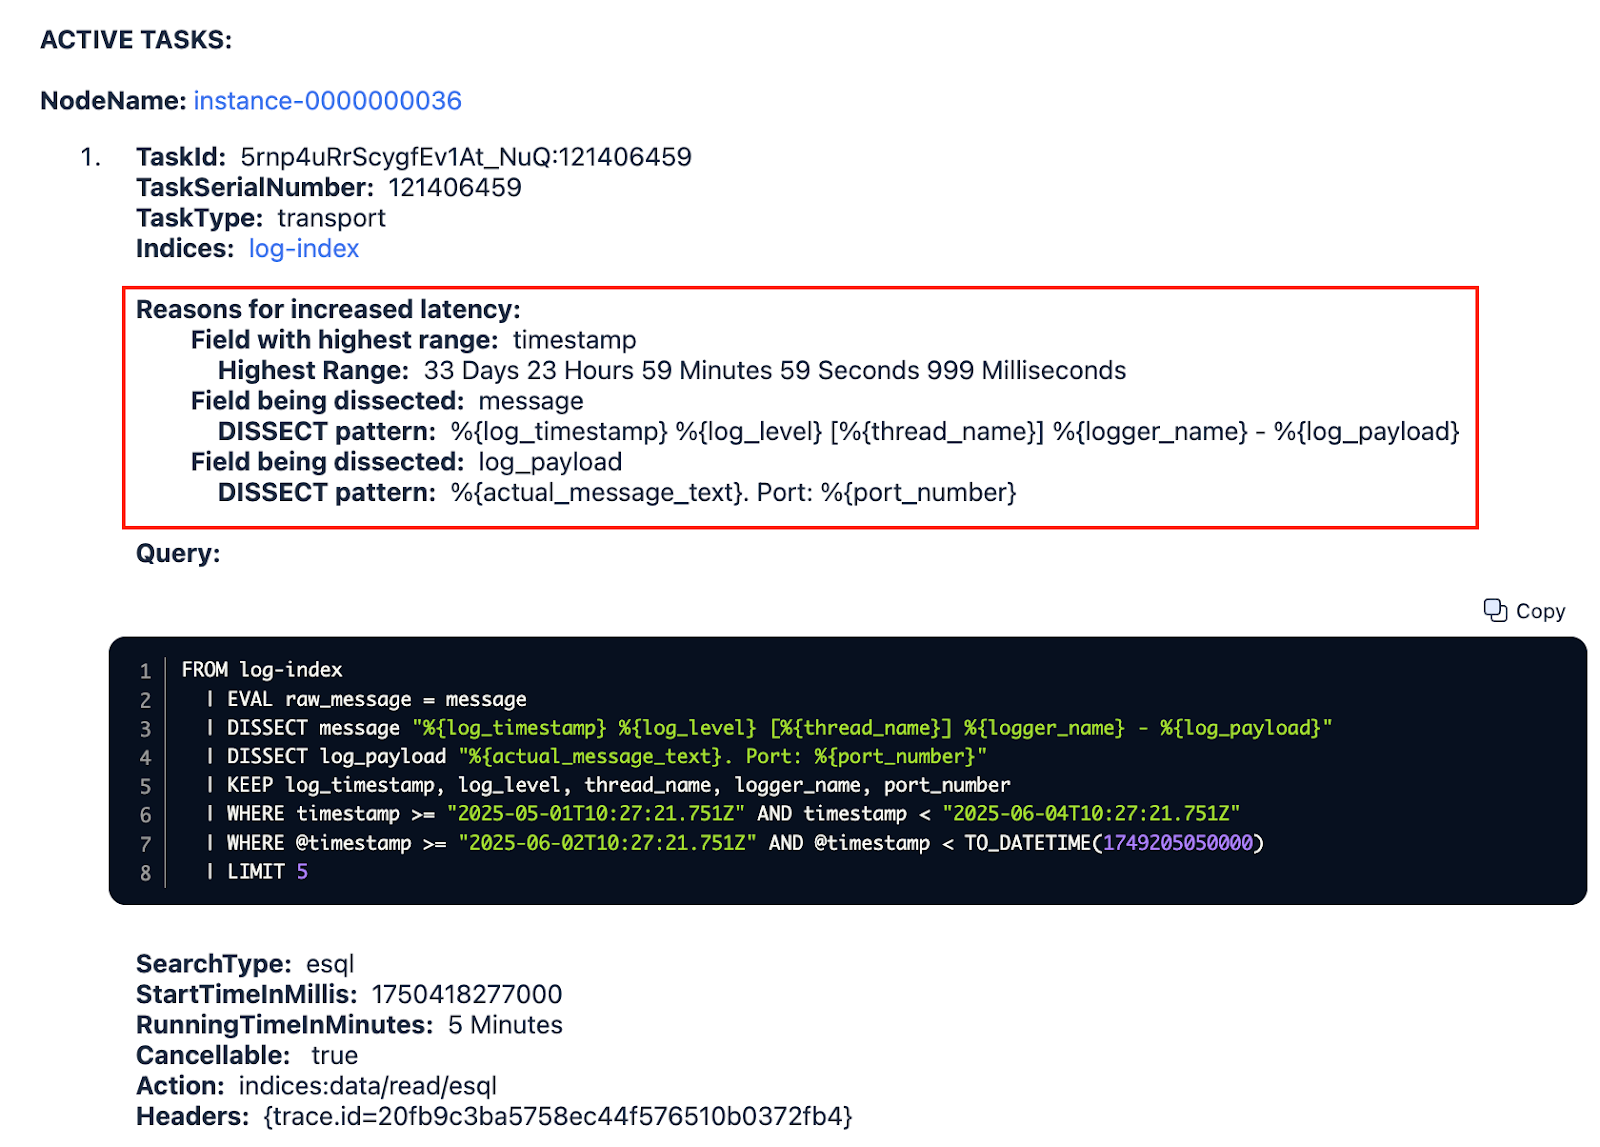
But wait, there's more! AutoOps not only detects long-running DSL queries, but also ES|QL ones. On the screenshot below, we can see that a slow ES|QL query has been detected by AutoOps.
All the same context information is available for ES|QL queries. Similarly to DSL queries, AutoOps also analyzes the query to surface potentially problematic clauses. For instance, AutoOps will detect:
- source commands like
FROM* orFROM index-*that could potentially span too many indices or data streams. - potentially heavy processing commands, such as
GROK,DISSECT,RLIKEandLOOKUP JOIN. - queries without any
WHEREconditions which could potentially execute on too much data. - conditions on timestamp fields that might span a too big time range.
After detecting long-running search query
Since this event is raised when a long-running search query has been detected, there are a few options forward. When inspecting the query, if it looks like a rogue query or a query run from Dev Tools by a careless user, then the task can simply be cancelled if it’s still running.
On the other hand, if it looks like a legitimate query and it is not running anymore, the next step should be to investigate the “reasons for increased latency” where AutoOps listed a few potential issues that were detected by inspecting the query. This is only done for DSL at this time, ES|QL will be supported in the future.
How long is long?
By default, AutoOps will raise a "Long running search task" event if the search query has been running for more than one minute. This is a default configuration setting that can easily be modified by clicking on the three dots icon at the top-right of the event fly out panel and then choosing “Customize” in order to change the default duration threshold.

After clicking on “Customize”, a dialog window pops up and offers the possibility to modify the duration threshold (in minutes) before raising "Long running search task" events.
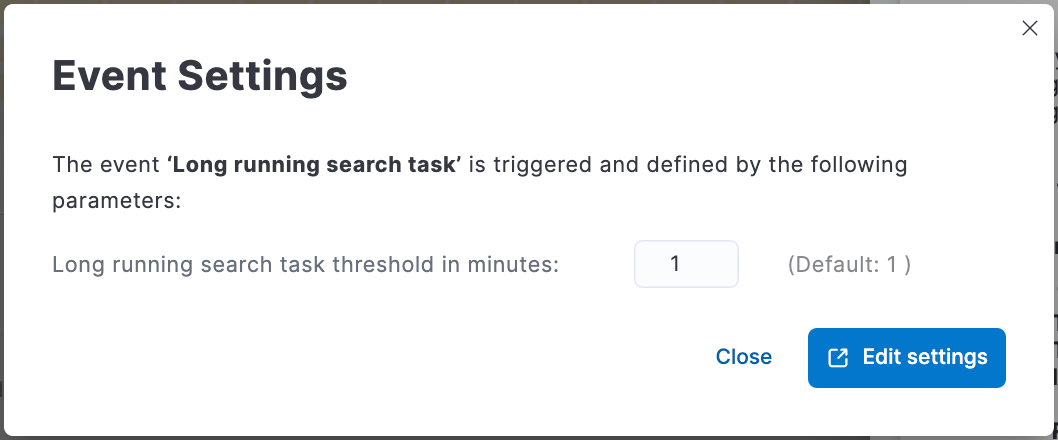
If AutoOps is monitoring several clusters, there’s also the opportunity to apply the custom setting only on specific clusters and not all.
Wrapping up
As we can see, AutoOps helps detect long-running search queries and dig out a wealth of information about them. Make sure to leverage all that information to improve your search queries and relieve your cluster as much as possible from unbearable loads.
Also note that the "Long running search task" event is just one out of hundreds of other insightful events that AutoOps knows to detect. If your deployment is in one of the supported regions, feel free to head over to your Elastic Cloud account and launch AutoOps to see how it makes cluster management so much simpler. Also stay tuned for future articles on other very helpful events and recommendations.
Ready to try this out on your own? Start a free trial.
Want to get Elastic certified? Find out when the next Elasticsearch Engineer training is running!
Related content
October 1, 2025
AutoOps: A journey to simplify self-managed Elasticsearch management
Exploring AutoOps for self-managed Elasticsearch (on-prem or privately hosted environments). We’ll showcase its value, how to set it up, and the insights it provides.
December 18, 2024
Resolving high CPU usage issues in Elasticsearch with AutoOps
How AutoOps pinpointed and resolved high CPU usage in an Elasticsearch cluster: A step-by-step case study.

November 20, 2024
Hotspotting in Elasticsearch and how to resolve them with AutoOps
Explore hotspotting in Elasticsearch and how to resolve it using AutoOps.
November 6, 2024
AutoOps makes every Elasticsearch deployment simple(r) to manage
AutoOps for Elasticsearch significantly simplifies cluster management with performance recommendations, resource utilization and cost insights, real-time issue detection and resolution paths.