Introduction
In the Elastic Stack, there are many LLM-powered agentic applications, such as the upcoming Elastic AI Agent in Agent Builder (currently in tech preview) and Attack Discovery (GA in 8.18 and 9.0+), with more in the works. During development, and even after deployment, it is important to answer these questions:
- How do we estimate the quality of responses of these AI applications?
- If we make a change, how do we guarantee that the change is truly an improvement and won’t cause degradation in the user experience?
- How can we easily test these results in a repeatable manner?
Unlike traditional software testing, evaluating generative AI applications involves statistical methods, nuanced qualitative review, and a deep understanding of user goals.
This article details the process the Elastic developer team employs for conducting evaluations, ensuring the quality of changes before deployment, and monitoring system performance. We aim to ensure every change is supported by evidence, leading to trusted and verifiable results. Part of this process is integrated directly into Kibana, reflecting our commitment to transparency as part of our open-source ethos. By openly sharing parts of our evaluation data and metrics, we seek to foster community trust and provide a clear framework for anyone developing AI agents or utilizing our products.
Product examples
The methods used in this document were the basis of how we iterated on and improved solutions like Attack Discovery and Elastic AI Agent. A brief introduction of the two, respectively:
Elastic Security’s Attack Discovery
Attack Discovery uses LLMs to identify and summarize attack sequences in Elastic. Given the Elastic Security alerts in a given timeframe (default 24 hours), Attack Discovery’s agentic workflow will automatically find if attack(s) have occurred, as well as important information such as which host or users were compromised, and which alerts contributed to the conclusion.
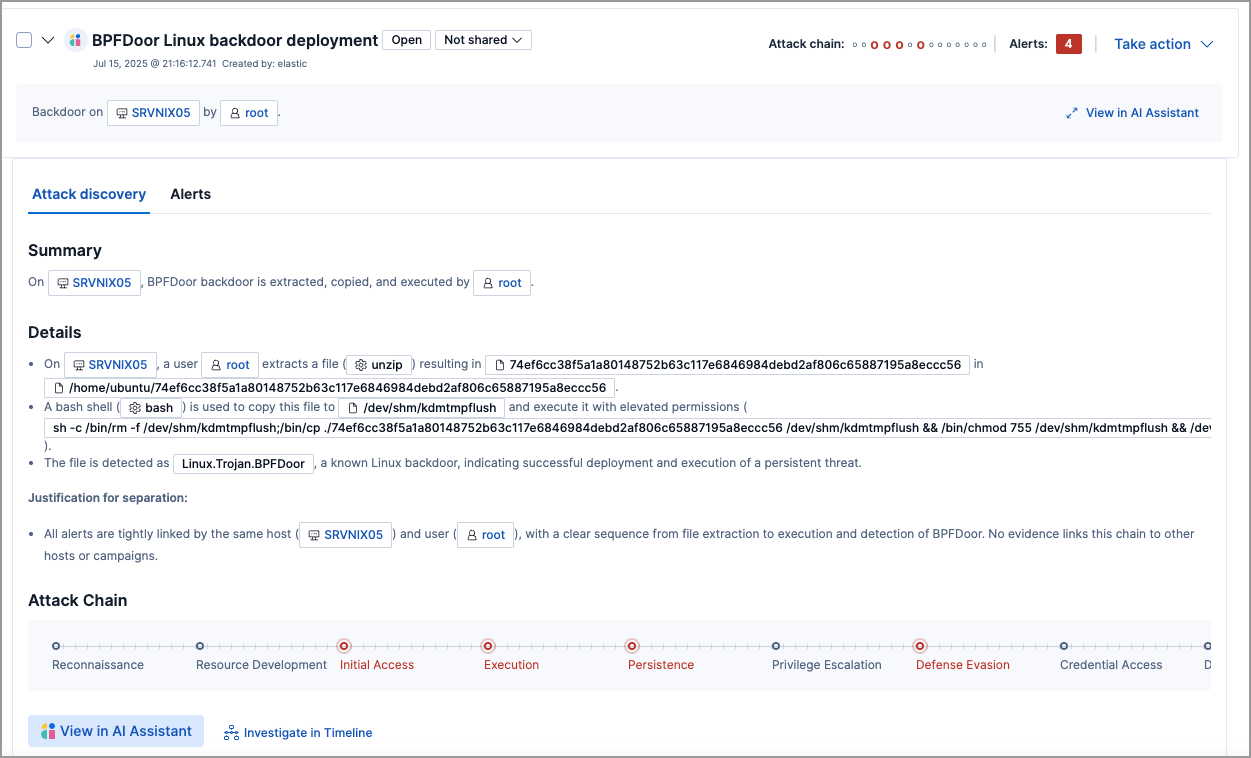
The goal is that the LLM-based solution would produce an output at least as good as a human would.
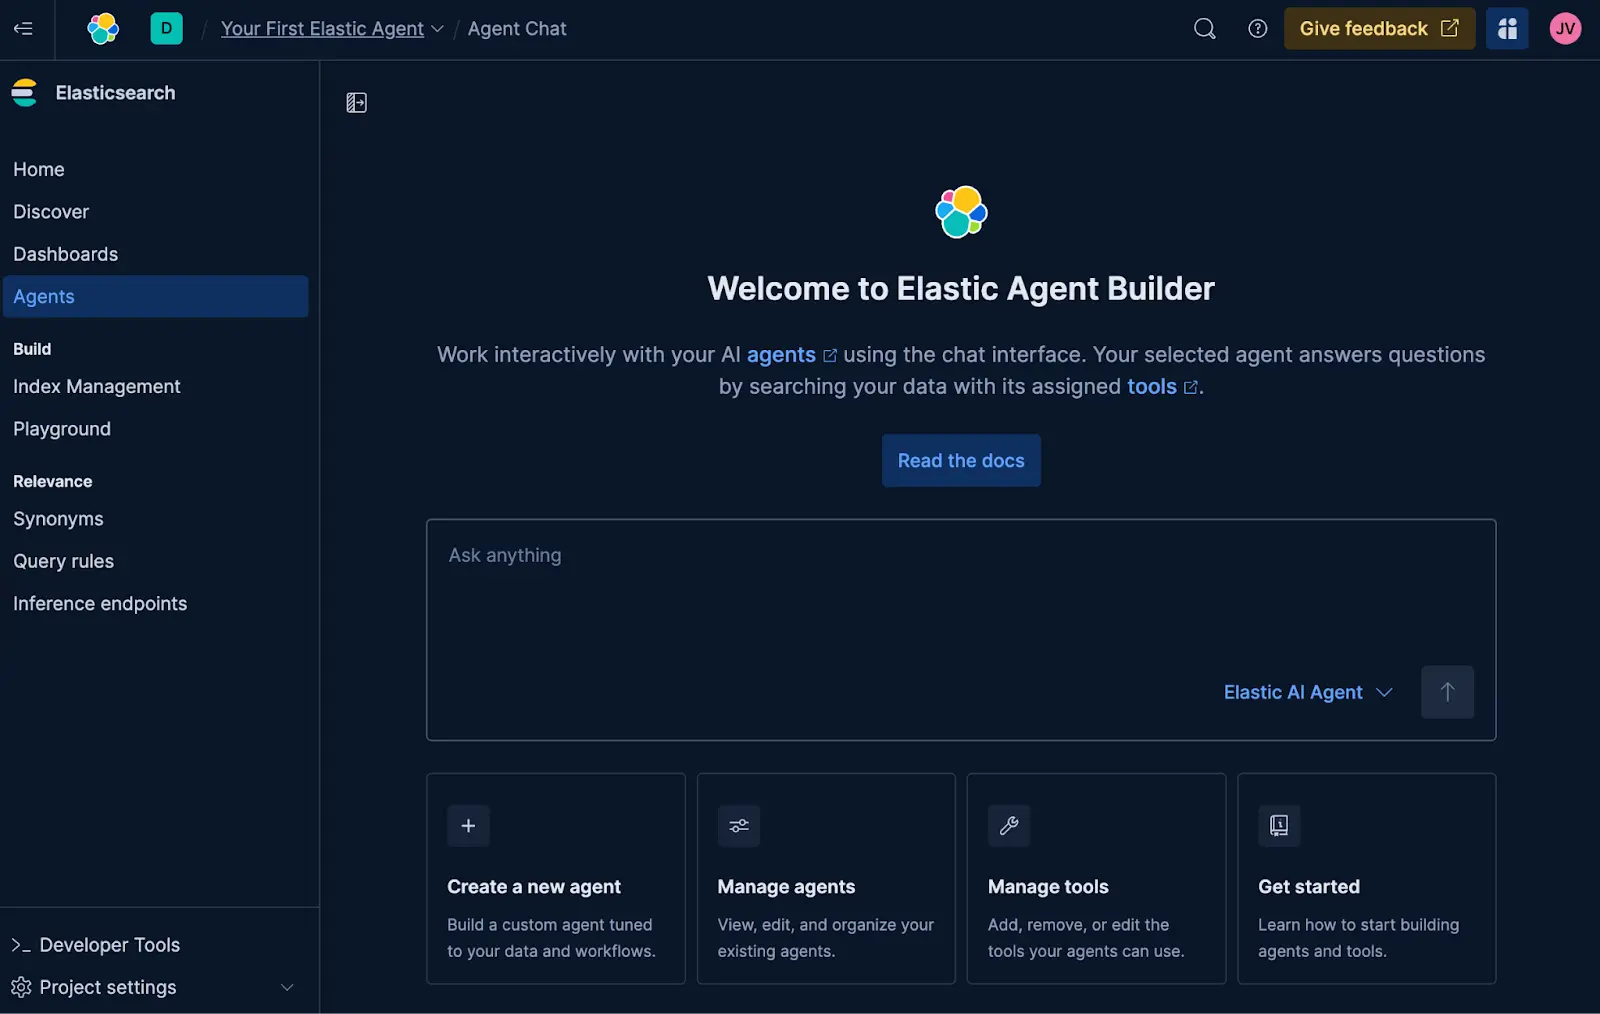
Elastic AI Agent
The Elastic Agent Builder is our new platform for building context-aware AI Agents that take advantage of all our search capabilities. It comes with the Elastic AI Agent, a pre-built, general-purpose agent designed to help users understand and get answers from their data through conversational interaction.
The agent achieves this by automatically identifying relevant information within Elasticsearch or connected knowledge bases and leveraging a suite of pre-built tools to interact with them. This enables the Elastic AI Agent to respond to a diverse range of user queries, from simple Q&A on a single document to complex requests requiring aggregation and single or multi-step searches across multiple indices.
Measuring improvements via experiments
In the context of AI agents, an experiment is a structured, testable change to the system designed to improve performance on well-defined dimensions (e.g., helpfulness, correctness, latency). The goal is to definitively answer: “If we merge this change, can we guarantee it’s a true improvement and won’t degrade the user experience?”
Most experiments that we conduct generally include:
- A hypothesis: A specific and falsifiable claim. Example: “Adding access to an attack discovery tool improves correctness in security-related queries.”
- Success criteria: Clear thresholds that define what “success” means. Example: “+5% improvement in correctness score on security dataset, no degradation elsewhere.”
- Evaluation plan: How we measure success (metrics, datasets, comparison method)
A successful experiment is a systematic process of inquiry. Every change, from a minor prompt tweak to a major architectural shift, follows these seven steps to ensure the results are meaningful and actionable:
- Step 1: Identify the problem
- Step 2: Define metrics
- Step 3: Formulate a clear hypothesis
- Step 4: Prepare evaluation dataset
- Step 5: Run the experiment
- Step 6: Analyze results + iterate
- Step 7: Make a decision and document
An example of these steps is illustrated in Figure 1. The following sub-sections will explain each step, and we will expand on the technical details of each step in upcoming documents.
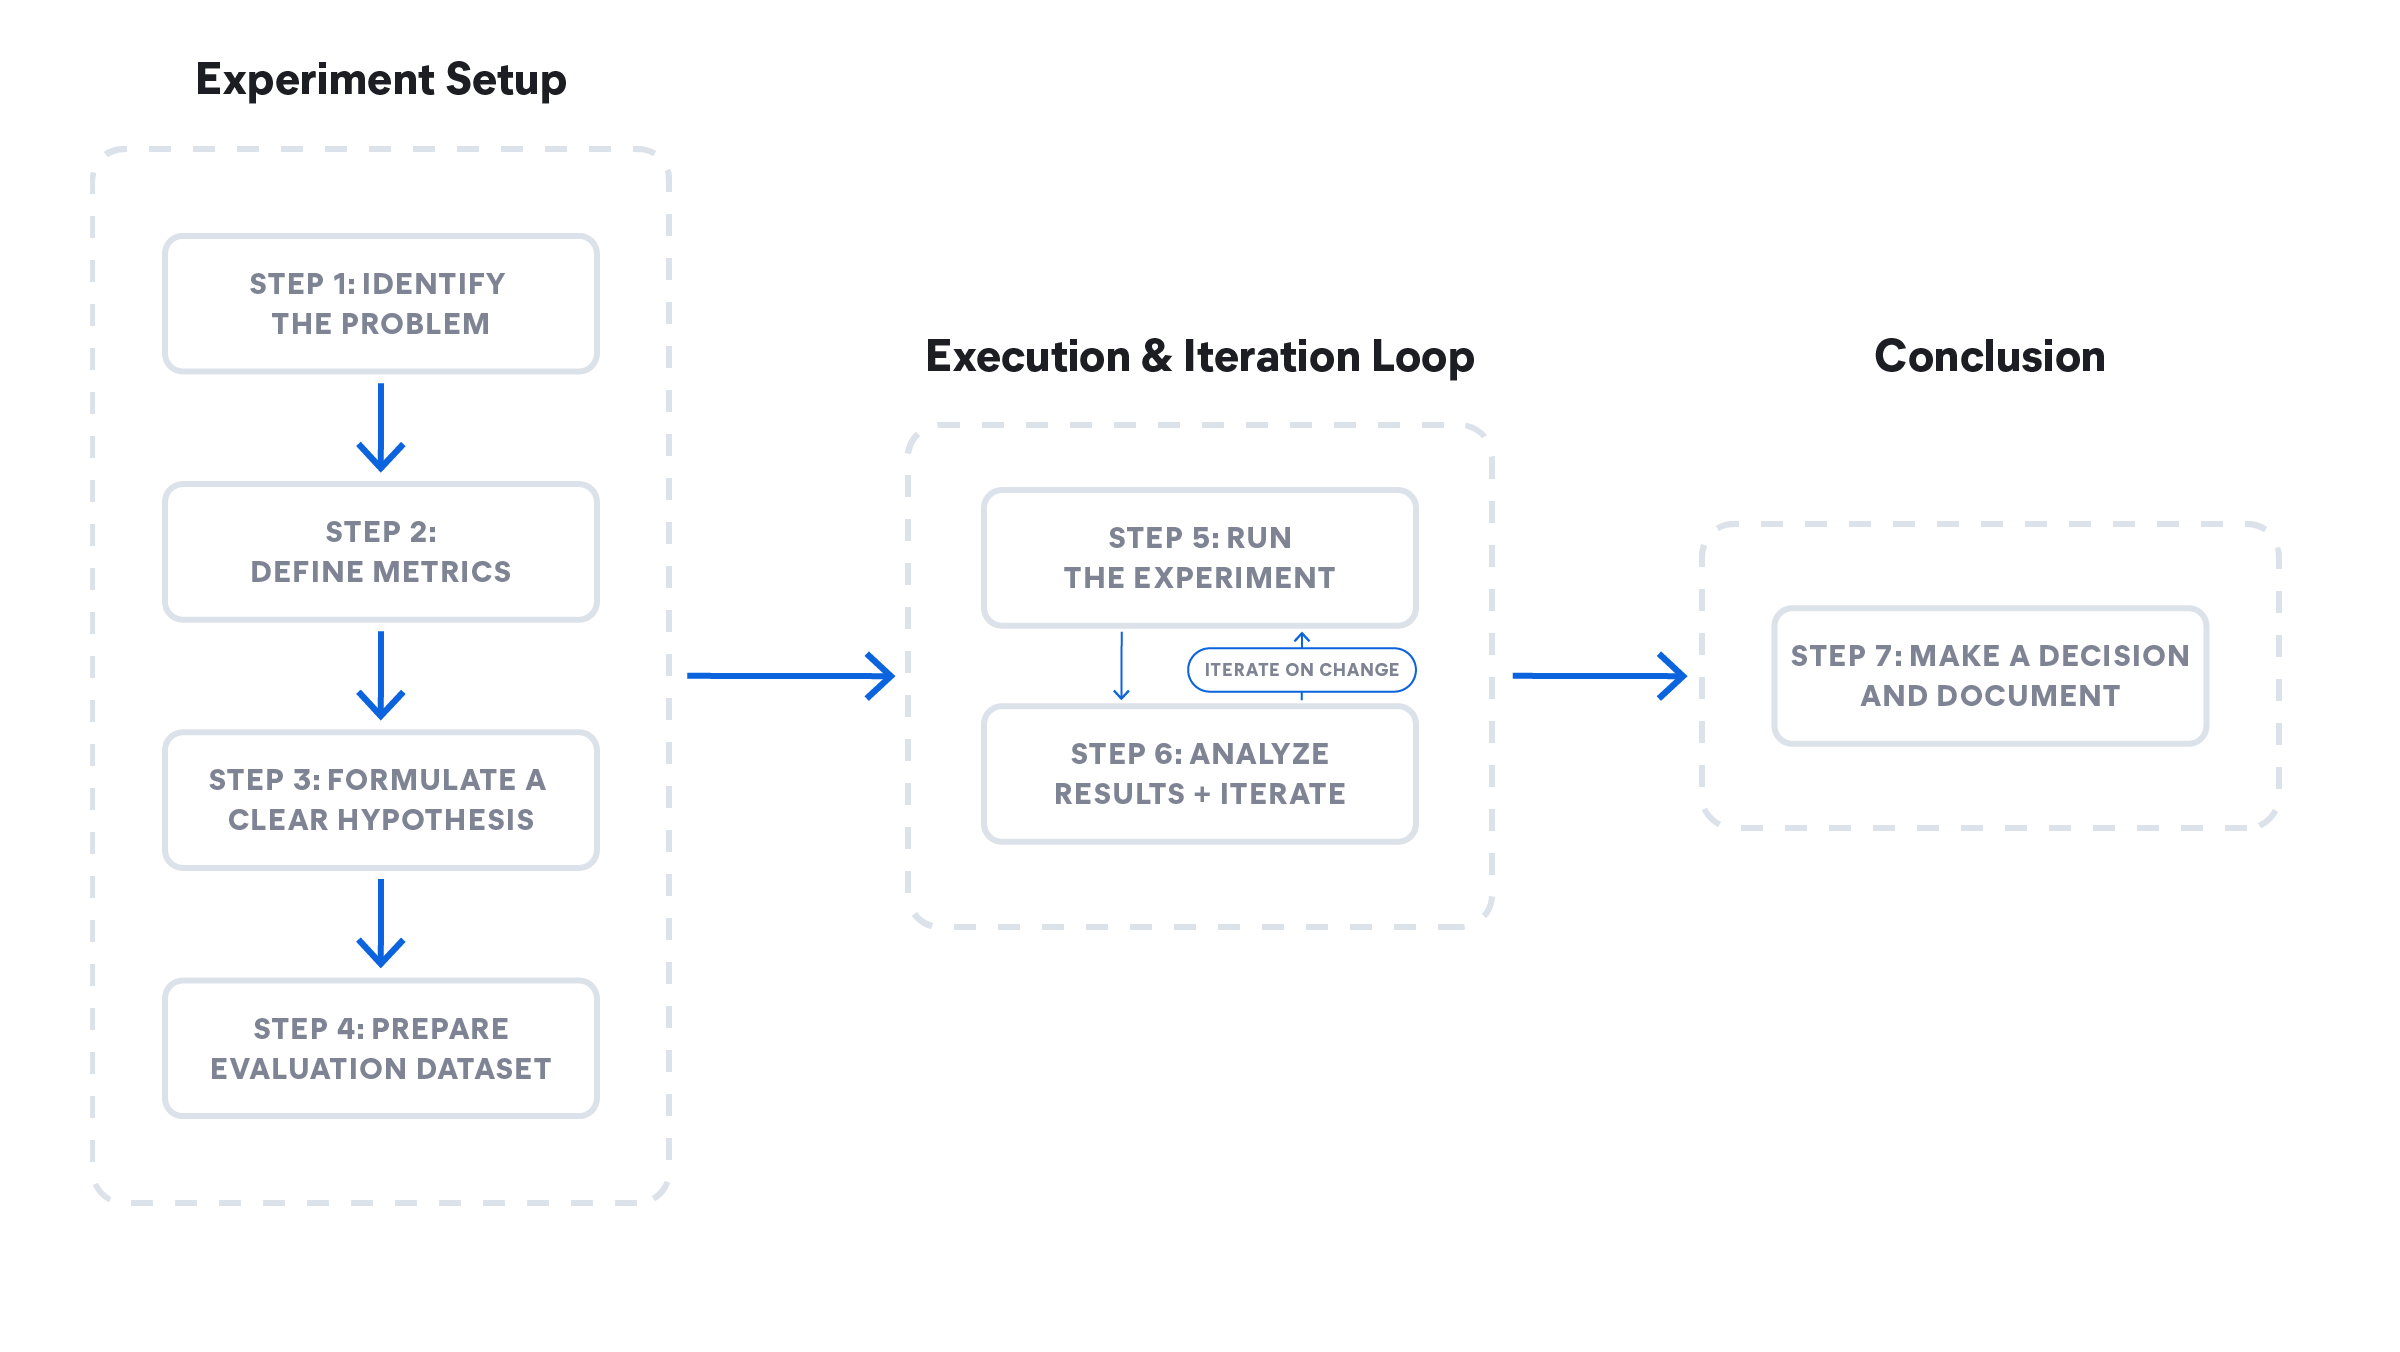
Figure 1: Steps in the experimentation lifecycle
Step-by-step walkthrough with real Elastic examples
Step 1: Identify the problem
What exactly is the problem this change is aimed at resolving?
Attack Discovery example: The summaries are occasionally incomplete, or benign activity is wrongly flagged as an attack (false positives).
Elastic AI Agent example: The agent's tool selection, especially for analytical queries, is suboptimal and inconsistent, often leading to the wrong tool being chosen. This, in turn, increases token costs and latency.
Step 2: Define metrics
Make the problem measurable, so that we can compare a change to the current state.
Common metrics include precision and recall, semantic similarity, factuality, and so on. Depending on the use case, we use code checks to compute the metrics, such as matching alert IDs or correctly retrieved URLs, or using techniques like LLM-as-judge for more free-form answers.
Below are some example metrics (not exhaustive) used in the experiments:
Attack discovery
| Metric | Description |
|---|---|
| Precision & recall | Match alertIDs between actual and expected outputs to measure detection accuracy. |
| Similarity | Use BERTScore to compare the semantic similarity of the response text. |
| Factuality | Are key IOCs (indicators of compromise) present? Are MITRE tactics (industry taxonomy of attacks) correctly reflected? |
| Attack chain consistency | Compare the number of discoveries to check for over- or under-reporting of the attack. |
Elastic AI Agent
| Metric | Description |
|---|---|
| Precision & recall | Match documents/information retrieved by the agent to answer a user query vs the actual information or documents needed to answer the query to measure information retrieval accuracy. |
| Factuality | Are the key facts required to answer the user query present? Are the facts in the right order for procedural queries? |
| Response relevance | Does the response contain information that is peripheral or unrelated to the user query? |
| Response completeness | Does the response answer all parts of the user query? Does the response contain all the information present in the ground truth? |
| ES|QL validation | Is the generated ES|QL syntactically correct? Is it functionally identical to the ground truth ES|QL? |
Step 3: Formulate a clear hypothesis
Establish a clear success criteria using the problem and the metrics defined above.
Elastic AI Agent example:
- Implement changes to the descriptions of the relevance_search and nl_search tools to clearly define their specific functions and use cases.
- We predict we will improve our tool invocation accuracy by 25%.
- We will verify this is a net positive by ensuring no negative impact on other metrics e.g. factuality and completeness.
- We believe this will work because precise tool descriptions will help the agent more accurately select and apply the most appropriate search tool for different query types, reducing misapplication and improving overall search effectiveness.
Step 4: Prepare evaluation dataset
To measure the performance of the system, we use datasets that capture real-world scenarios.
Depending on the type of evaluation we are conducting, we may need different types of data formats, such as raw data fed to an LLM (e.g. attack scenarios for Attack Discovery) and expected outputs. If the application is a chatbot, then the inputs may be user queries, and the outputs may be correct chatbot responses, correct links it should have retrieved, and so on.
Attack Discovery example:
| 10 novel attack scenarios |
|---|
| 8 Oh My Malware episodes (ohmymalware.com) |
| 4 multi-attack scenarios (created by combining attacks in the first 2 categories) |
| 3 benign scenarios |
Elastic AI agent evaluation dataset example (Kibana Dataset Link):
| 14 Indices using open source datasets to simulate multiple sources in KB. |
|---|
| 5 Query types (analytical, text retrieval, hybrid…) |
| 7 Query intent types (procedural , factual - classification, investigative; …) |
Step 5: Run the experiment
Execute the experiment by generating responses from both the existing agent and the modified version against the evaluation dataset. Calculate metrics such as factuality (see step 2).
We mix various evaluations based on the metrics required in Step 2:
- Rule-based evaluation (e.g. use Python/TypeScript to check if .json is valid)
- LLM-as-judge (asking a separate LLM if a response is factually consistent with a source document)
- Human in the loop review for nuance quality checks
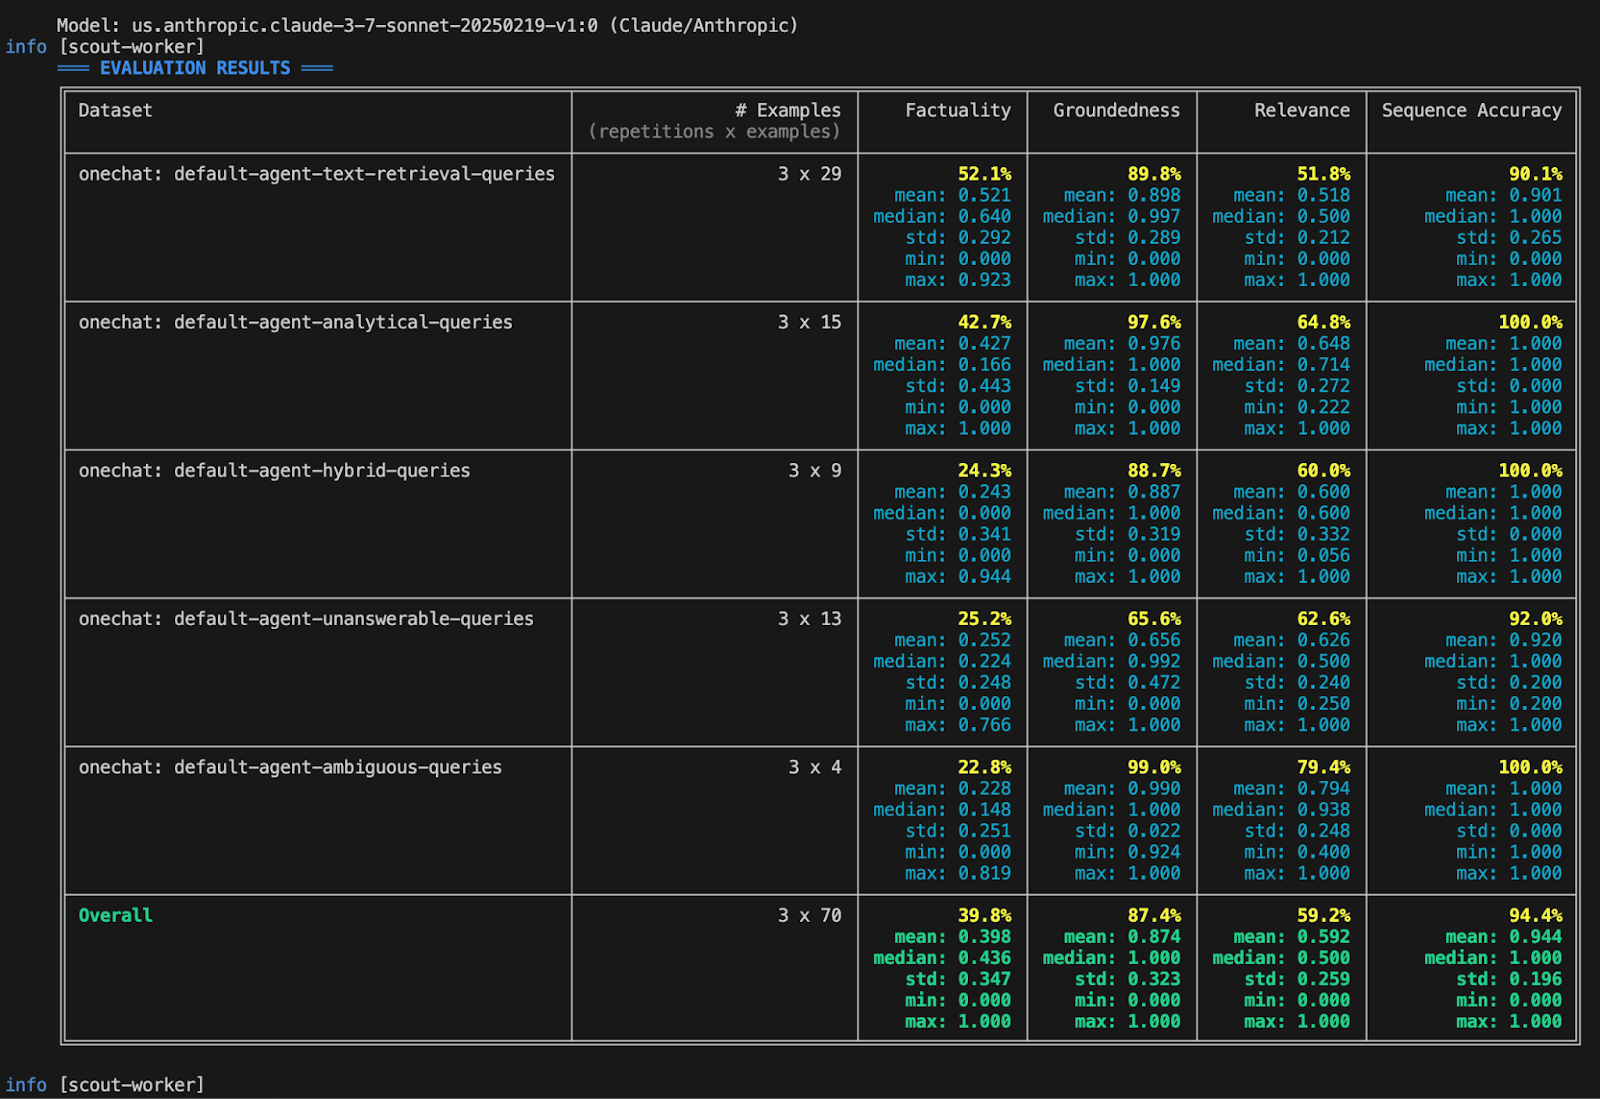
This is an example of an evaluation result generated by our internal framework. It presents various metrics from an experiment conducted across different datasets.
Step 6: Analyze results + iterate
Now that we have the metrics, we analyze the results. Even if the results meet the success criteria defined in step 3, we’ll still have a human review before merging the change to production; if the results don't meet the criteria, iterate and fix the issues, and then run the evaluations on the new change.
We expect it will take a few iterations to find the best change before merging. Similar to running local software tests before pushing a commit, offline evaluations can be run with local changes or multiple proposed changes. It’s useful to automate the saving of experiment results, composite scores, and visualizations to streamline the analysis.
Step 7: Make a decision and document
Based on a decision framework and acceptance criteria, decide on merging the change, and document the experiment. Decision making is multi-faceted and can consider factors beyond the evaluation dataset, such as checking for regression scenarios on other datasets or weighing the cost–benefit of a proposed change.
Example: After testing and comparing a few iterations, choose the top-scoring change to send out to product managers and other relevant stakeholders for approval. Attach the results from the previous steps to help guide the decision. For more examples on the Attack Discovery side, see Behind the scenes of Elastic Security’s generative AI features.
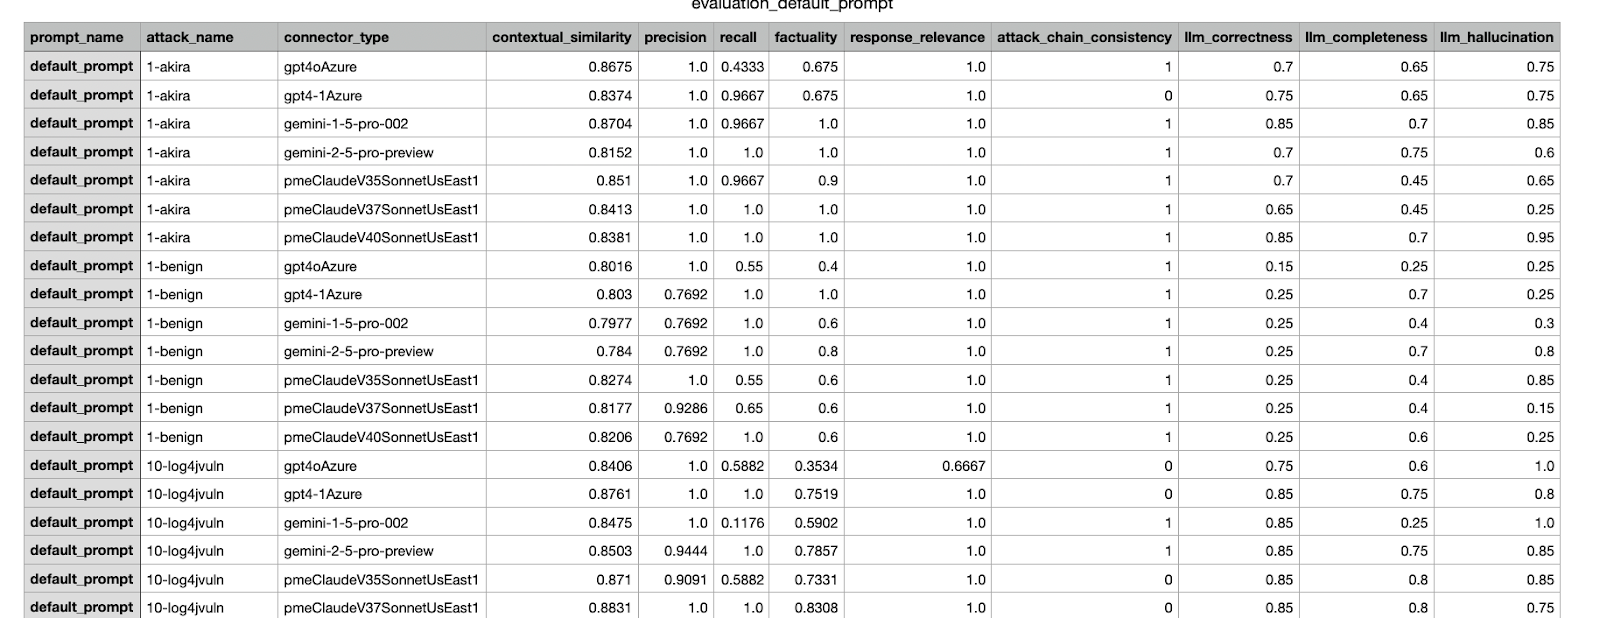
Example of a CSV report sent out to stakeholders; the highest-scoring experiment was selected to be merged.
Conclusion
In this blog, we walked through the end-to-end process of an experiment workflow, illustrating how we evaluate and test changes to an agentic system before releasing them to Elastic users. We also provided some examples of improving agent-based workflows in Elastic. In subsequent blog posts, we will expand on the details of different steps, such as how to create a good dataset, how to design reliable metrics, and how to make decisions when multiple metrics are involved.
Ready to try this out on your own? Start a free trial.
Want to get Elastic certified? Find out when the next Elasticsearch Engineer training is running!
Related content
October 10, 2025
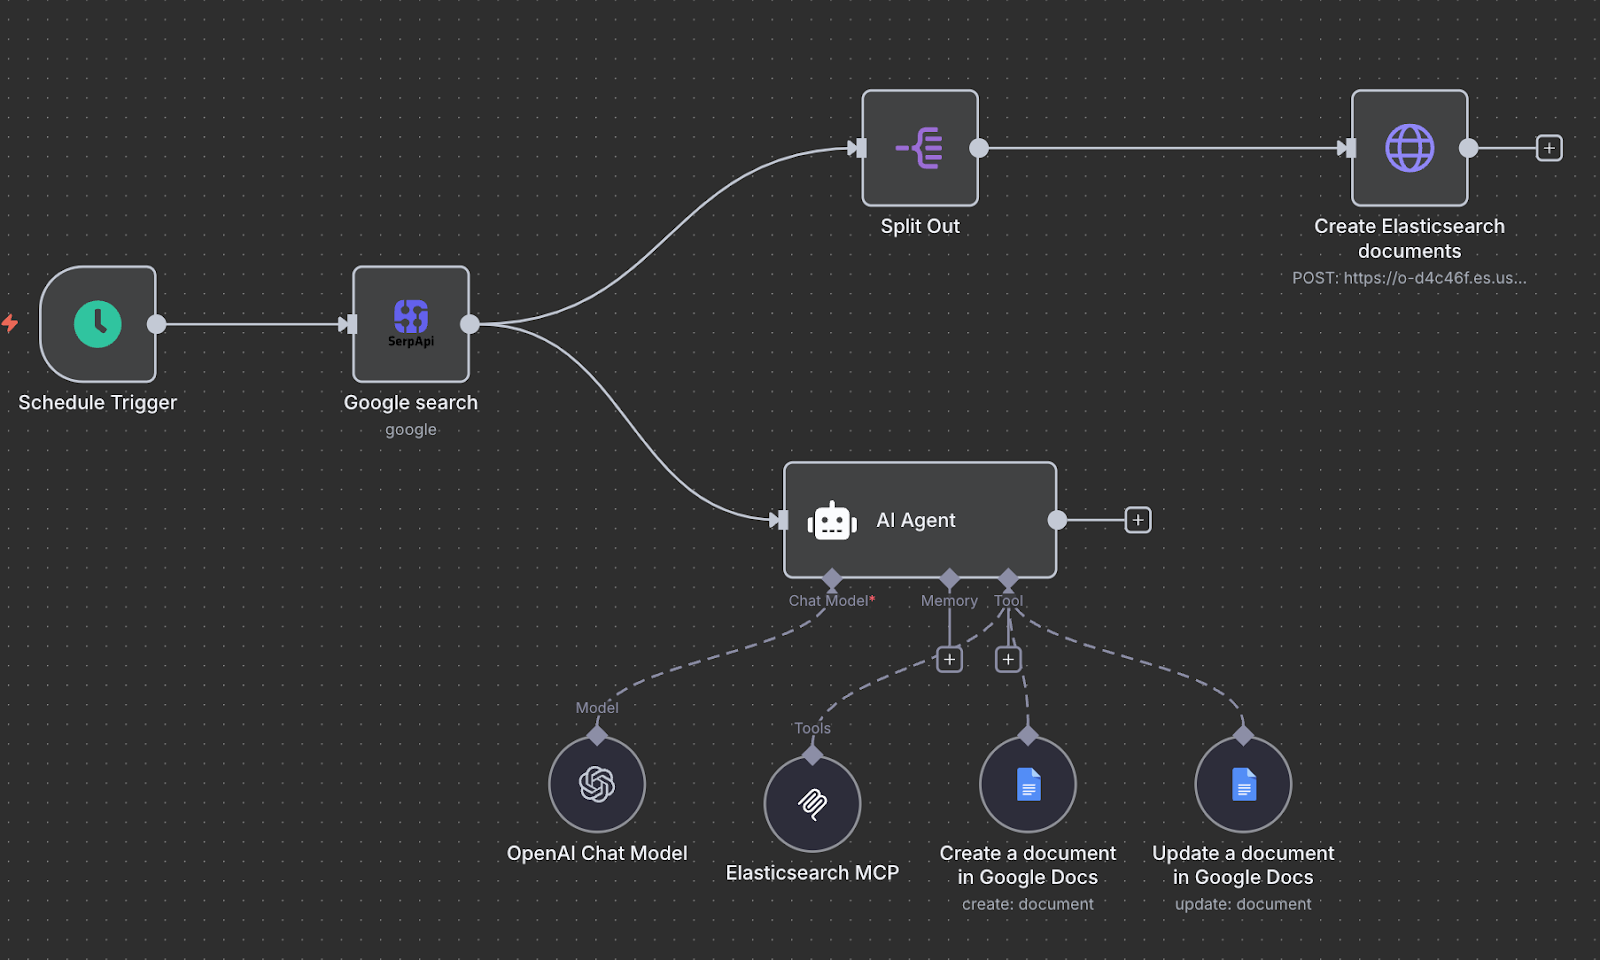
Creating an AI agent with n8n and MCP
Exploring how to build a trend analytics agent with n8n while leveraging the Elasticsearch MCP server.

October 9, 2025
Connecting Elastic Agents to Agentspace via A2A protocol
Learn how to use Agent Builder to expose your custom Elastic Agent to external services like Google's Agentspace with the A2A protocol.

October 6, 2025
Experiments in improving Agentic AI tools for Elasticsearch
Learn how we improved AI agent workflows for Elasticsearch through iterative experiments by combining linear retrievers, hybrid search, and semantic_text for scalable RAG optimization.

September 30, 2025
CI/CD pipelines with agentic AI: How to create self-correcting monorepos
How our team introduced GenAI into CI pipelines to create self-correcting pull requests, automizing the update of hundreds of dependencies in large monorepos

September 25, 2025
Your first Elastic Agent: From a single query to an AI-powered chat
Learn how to use Elastic’s AI Agent builder to create specialized AI agents. In this blog, we'll be building a financial AI Agent.