Kibana Lens makes dashboards drag and drop very simple, but when you need dozens of panels, the clicks add up. What if you could sketch a dashboard, screenshot it, and let an LLM finish the entire process for you?
In this article, we will make that happen. We will create an application that takes an image of a dashboard, analyzes our mappings, and then generates a dashboard without us having to touch Kibana at all!
Steps:
Background & application workflow
The first thought that came to mind was letting the LLM generate the entire NDJSON format Kibana saved objects and then import them to Kibana.
We tried a handful of models:
- Gemini 2.5 pro
- GPT o3 / o4-mini-high / 4.1
- Claude 4 sonnet
- Grok 3
- Deepseek (Deepthink R1)
And for prompts, we started as simple as:
You are an Elasticsearch Saved-Object generator (Kibana 9.0).
INPUTS
=====
1. PNG screenshot of a 4-panel dashboard (attached).
2. Index mapping (below) – trimmed down to only the fields present in the screenshot.
3. Example NDJSON of *one* metric visualization (below) for reference.

TASK
====
Return **only** a valid NDJSON array that recreates the dashboard exactly:
* 2 metric panels (Visits, Unique Visitors)
* 1 pie chart (Most used OS)
* 1 vertical bar chart (State Geo Dest)
* Use index pattern `kibana_sample_data_logs`.
* Preserve roughly the same layout (2×2 grid).
* Use `panelIndex` values 1-4 and random `id` strings.
* Kibana version: 9.0
Despite going through few-shot examples and detailed explanations on how to build each visualization, we had no luck. If you are interested in this experimentation, you can find details here.
The result with this approach was seeing these messages when trying to upload to Kibana the files produced by the LLM:
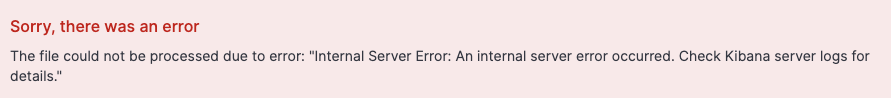
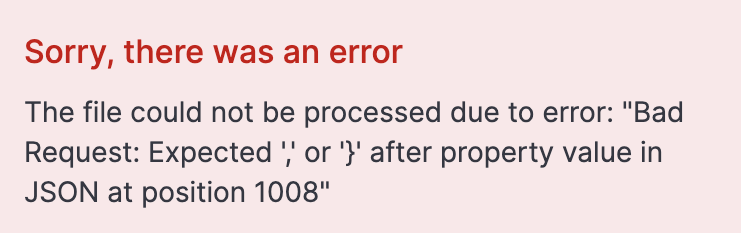
This means the generated JSON is invalid or badly formatted. The most common issues were the LLM producing incomplete NDJSON, hallucinating parameters, or returning regular JSON instead of NDJSON no matter how hard we tried to enforce otherwise.
Inspired by this article –where search templates worked better than LLM freestyle – we decided to give templates to the LLM instead of asking to generate the full NDJSON file and then us, in code, use the parameters given by the LLM to create the proper visualizations.This approach didn't disappoint, and it’s predictable and extendable, as now the code is doing the heavy lifting and not the LLM.
The application workflow will be the following:
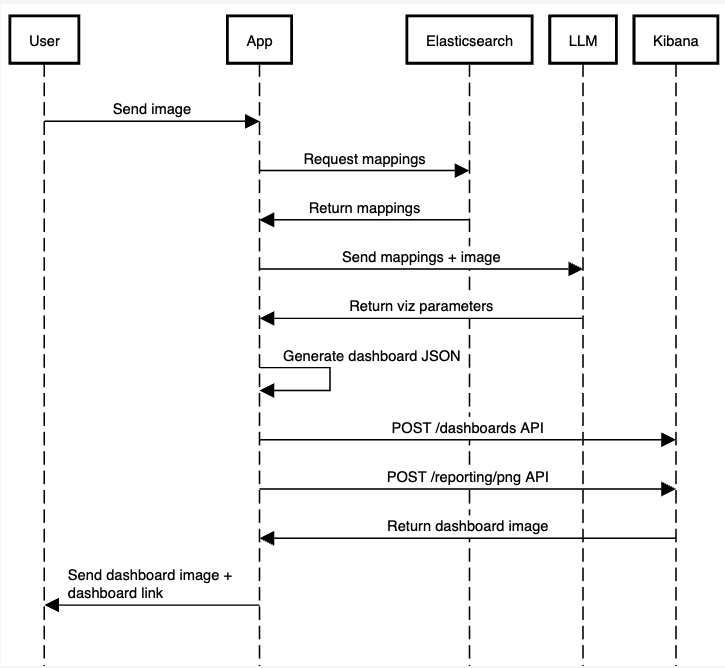
We will omit some code for simplicity, but you can find the working code for the full application on this notebook.
Prerequisites
Before you start developing, you’ll need the following:
- Python 3.8 or higher
- A Venv Python environment
- An Elasticsearch instance running, along with its endpoint and API key
- An OpenAI API key stored under the environment variable name OPENAI_API_KEY:
export OPENAI_API_KEY="your-openai-api-key"Prepare data
For the data, we will keep it simple and use Elastic sample web logs. You can learn how to import that data to your cluster here.
Each document includes details about the host that issued requests to the application, along with information about the request itself and its response status. Below is an example document:
{
    "agent": "Mozilla/5.0 (X11; Linux i686) AppleWebKit/534.24 (KHTML, like Gecko) Chrome/11.0.696.50 Safari/534.24",
    "bytes": 8509,
    "clientip": "70.133.115.149",
    "extension": "css",
    "geo": {
        "srcdest": "US:IT",
        "src": "US",
        "dest": "IT",
        "coordinates": {
            "lat": 38.05134111,
            "lon": -103.5106908
        }
    },
    "host": "cdn.elastic-elastic-elastic.org",
    "index": "kibana_sample_data_logs",
    "ip": "70.133.115.149",
    "machine": {
        "ram": 5368709120,
        "os": "osx"
    },
    "memory": null,
    "message": "70.133.115.149 - - [2018-08-30T23:35:31.492Z] \"GET /styles/semantic-ui.css HTTP/1.1\" 200 8509 \"-\" \"Mozilla/5.0 (X11; Linux i686) AppleWebKit/534.24 (KHTML, like Gecko) Chrome/11.0.696.50 Safari/534.24\"",
    "phpmemory": null,
    "referer": "http://twitter.com/error/john-phillips",
    "request": "/styles/semantic-ui.css",
    "response": 200,
    "tags": [
        "success",
        "info"
    ],
    "@timestamp": "2025-07-03T23:35:31.492Z",
    "url": "https://cdn.elastic-elastic-elastic.org/styles/semantic-ui.css",
    "utc_time": "2025-07-03T23:35:31.492Z",
    "event": {
        "dataset": "sample_web_logs"
    },
    "bytes_gauge": 8509,
    "bytes_counter": 51201128
}
Now, let’s grab the mappings of the index we just loaded, kibana_sample_data_logs:
INDEX_NAME = "kibana_sample_data_logs"

es_client = Elasticsearch(
    [os.getenv("ELASTICSEARCH_URL")],
    api_key=os.getenv("ELASTICSEARCH_API_KEY"),
)

result = es_client.indices.get_mapping(index=INDEX_NAME)
index_mappings = result[list(result.keys())[0]]["mappings"]["properties"]
We are going to pass the mappings along with the image we will load later.
LLM configuration
Let’s configure the LLM to use structured output to input an image and receive a JSON with the information we need to pass to our function to produce the JSON objects.
We install the dependencies:
pip install elasticsearch pydantic langchain langchain-openai -qElasticsearch will help us retrieve the index mappings. Pydantic allows us to define schemas in Python to then ask the LLM to follow, and LangChain is the framework that helps make it easier to call LLMs and AI tools.
We will create a Pydantic schema to define the output we want from the LLM. What we need to know from the image is the type of chart, field, visualization title, and dashboard title:
class Visualization(BaseModel):
    title: str = Field(description="The dashboard title")
    type: List[Literal["pie", "bar", "metric"]]
    field: str = Field(
        description="The field that this visualization use based on the provided mappings"
    )


class Dashboard(BaseModel):
    title: str = Field(description="The dashboard title")
    visualizations: List[Visualization]
For the image input we will send a dashboard I just drew:
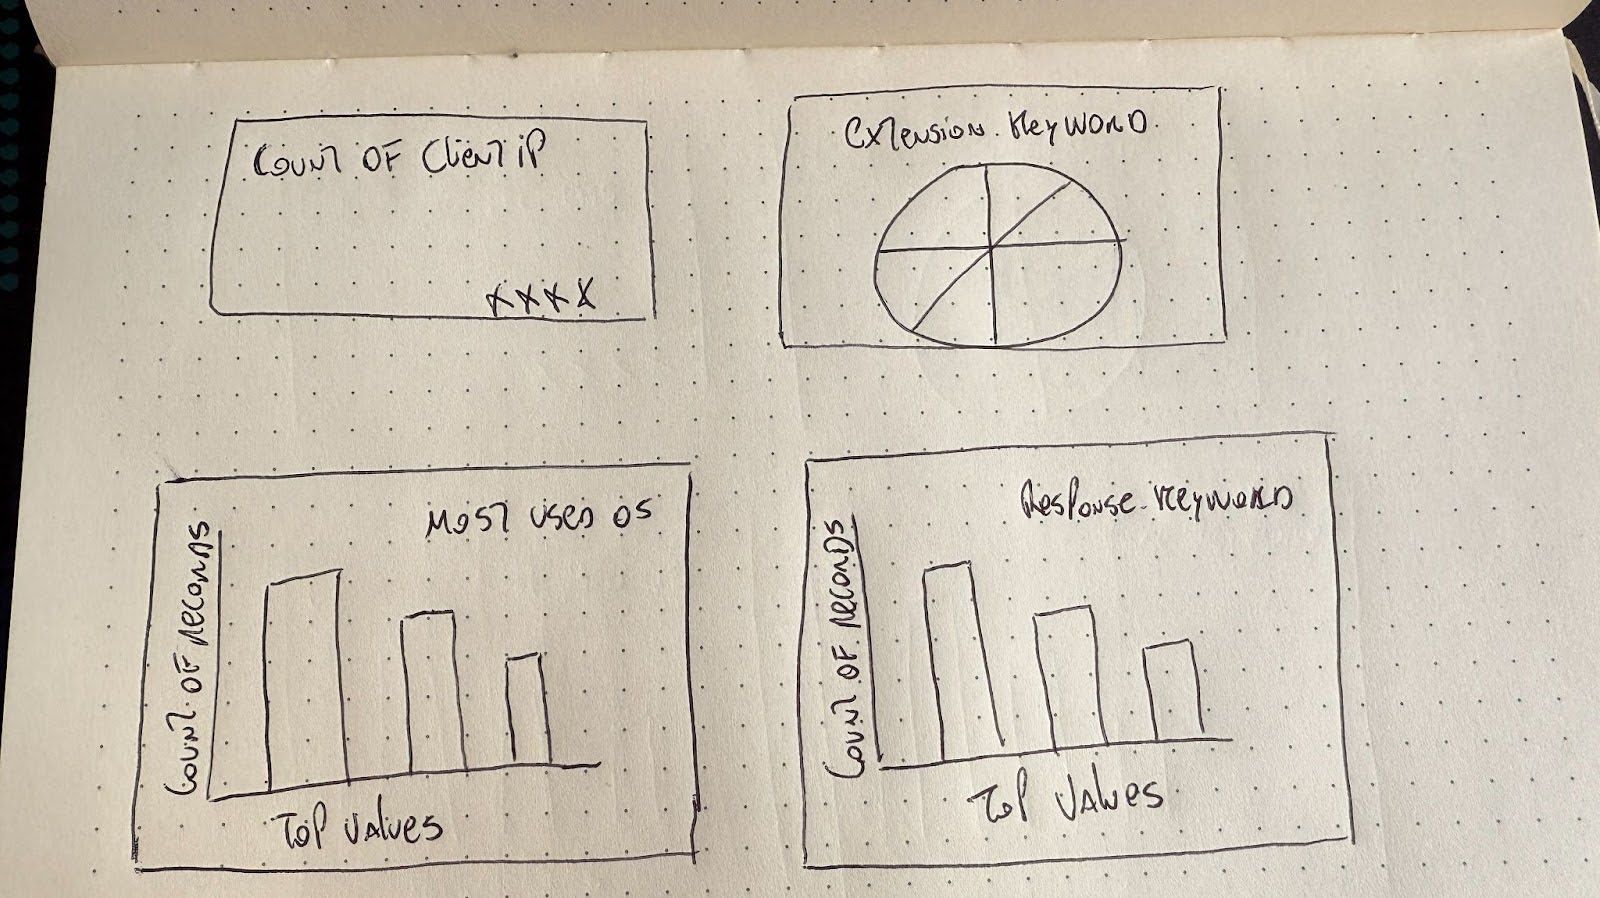
Now we declare the LLM model call and image loading. This function will receive the mappings of the Elasticsearch index and an image of the dashboard we want to generate.
With with_structured_output we can use our Pydantic Dashboard schema as the response object the LLM will produce. With Pydantic, we can define data models with validation, which ensures the LLM output matches the expected structure.
To convert the image to base64 and send it as input, you can use an online converter or do it in code.
prompt = f"""
    You are an expert in analyzing Kibana dashboards from images for the version 9.0.0 of Kibana.

    You will be given a dashboard image and an Elasticsearch index mapping.

    Below are the index mappings for the index that the dashboard is based on.
    Use this to help you understand the data and the fields that are available.

    Index Mappings:
    {index_mappings}

    Only include the fields that are relevant for each visualization, based on what is visible in the image.
    """

message = [
    {
        "role": "user",
        "content": [
            {"type": "text", "text": prompt},
            {
                "type": "image",
                "source_type": "base64",
                "data": image_base64,
                "mime_type": "image/png",
            },
        ],
    }
]


try:
    llm = init_chat_model("gpt-4.1-mini")
    llm = llm.with_structured_output(Dashboard)
    dashboard_values = llm.invoke(message)

    print("Dashboard values generated by the LLM successfully")
    print(dashboard_values)
except Exception as e:
    print(f"Failed to analyze image and match fields: {str(e)}")
The LLM already has context about Kibana dashboards, so we don’t need to explain everything in the prompt, just some details to make sure it doesn't forget it is working with Elasticsearch and Kibana.
Let’s break down the prompt:
| Section | Reason |
|---|---|
| You are an expert in analyzing Kibana dashboards from images for the version 9.0.0 of Kibana. | By reinforcing this is Elasticsearch, and the Elasticsearch version we reduce the likelihood of the LLM to hallucinate old/invalid parameters. |
| You will be given a dashboard image and an Elasticsearch index mapping. | We explain that the image is about dashboards to avoid any wrong interpretations by the LLM. |
| Below are the index mappings for the index that the dashboard is based on.Use this to help you understand the data and the fields that are available. Index Mappings: {index_mappings} | It is crucial to provide the mappings so the LLM can pick valid fields dynamically. Otherwise we could hard code the mappings here which is too rigid, or rely on the image containing the right field names which is not reliable. |
| Only include the fields that are relevant for each visualization, based on what is visible in the image. | We had to add this reinforcement because sometimes it will try to add fields which are not relevant to the image. |
This will return an object with an array of visualizations to display:
"Dashboard values generated by the LLM successfully
title=""Client, Extension, OS, and Response Keyword Analysis""visualizations="[
   "Visualization(title=""Count of Client IP",
   "type="[
      "metric"
   ],
   "field=""clientip"")",
   "Visualization(title=""Extension Keyword Distribution",
   "type="[
      "pie"
   ],
   "field=""extension.keyword"")",
   "Visualization(title=""Most Used OS",
   "type="[
      "bar"
   ],
   "field=""machine.os.keyword"")",
   "Visualization(title=""Response Keyword Distribution",
   "type="[
      "bar"
   ],
   "field=""response.keyword"")"
]
Processing LLM response
We created a sample 2x2 panel dashboard and then exported it in JSON using the Get a dashboard API, and then we stored the panels as visualization templates (pie, bar, metric) where we can replace some of the parameters to create new visualizations with different fields depending on the question.
You can see the template JSON files here. Note how we changed the object values we want to replace later with {variable_name}
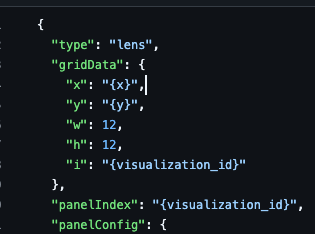
With the information the LLM provided us, we can decide which template to use and which values to replace.
fill_template_with_analysis will receive the parameters for a single panel, including the JSON template of the visualization, a title, a field, and coordinates of the visualization on the grid.
Then, it will replace the values of the template and return the final JSON visualization.
def fill_template_with_analysis(
    template: Dict[str, Any],
    visualization: Visualization,
    grid_data: Dict[str, Any],
):
    template_str = json.dumps(template)
    replacements = {
	 "{visualization_id}": str(uuid.uuid4()),
        "{title}": visualization.title,
        "{x}": grid_data["x"],
        "{y}": grid_data["y"],
    }

    if visualization.field:
        replacements["{field}"] = visualization.field

    for placeholder, value in replacements.items():
        template_str = template_str.replace(placeholder, str(value))

    return json.loads(template_str)
To keep it simple, we will have static coordinates we will assign to the panels the LLM decides to create and produce a 2x2 grid dashboard as the image above.
# Filling templates fields
panels = []
grid_data = [
    {"x": 0, "y": 0},
    {"x": 12, "y": 0},
    {"x": 0, "y": 12},
    {"x": 12, "y": 12},
]


i = 0

for vis in dashboard_values.visualizations:
    for vis_type in vis.type:
        template = templates.get(vis_type, templates.get("bar", {}))
        filled_panel = fill_template_with_analysis(template, vis, grid_data[i])
        panels.append(filled_panel)
        i += 1
Depending on the visualization type decided by the LLM, we will pick a JSON file template and replace the relevant information using fill_template_with_analysis , then append the new panel to an array we will use later to create the dashboard.
When the dashboard is ready, we will use the Create a dashboard API to push the new JSON file to Kibana to generate the dashboard:
try:
    dashboard_id = str(uuid.uuid4())

    # post request to create the dashboard endpoint
    url = f"{os.getenv('KIBANA_URL')}/api/dashboards/dashboard/{dashboard_id}"

    dashboard_config = {
        "attributes": {
            "title": dashboard_values.title,
            "description": "Generated by AI",
            "timeRestore": True,
            "panels": panels,  # Visualizations with the values generated by the LLM
            "timeFrom": "now-7d/d",
            "timeTo": "now",
        },
    }

    headers = {
        "Content-Type": "application/json",
        "kbn-xsrf": "true",
        "Authorization": f"ApiKey {os.getenv('ELASTICSEARCH_API_KEY')}",
    }

    requests.post(
        url,
        headers=headers,
        json=dashboard_config,
    )

    # Url to the generated dashboard
    dashboard_url = f"{os.getenv('KIBANA_URL')}/app/dashboards#/view/{dashboard_id}"

    print("Dashboard URL: ", dashboard_url)
    print("Dashboard ID: ", dashboard_id)

except Exception as e:
    print(f"Failed to create dashboard: {str(e)}")
To execute the script and generate the dashboard, run the following command in the console:
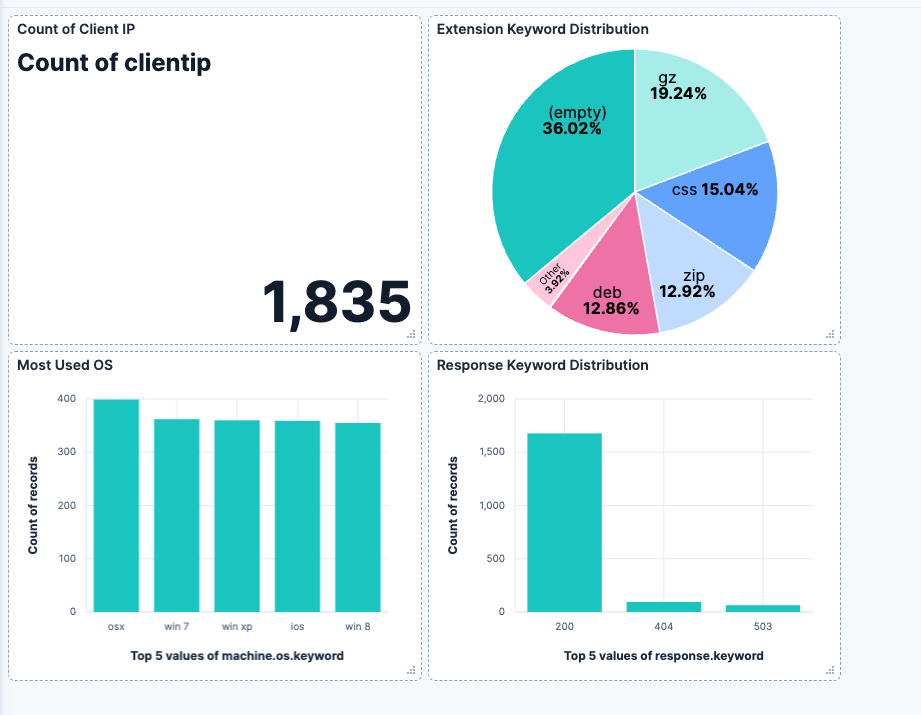
python <file_name>.pyThe final result will look like this:
Dashboard URL: https://your-kibana-url/app/dashboards#/view/generated-dashboard-id
Dashboard ID: generated-dashboard-id
Conclusion
LLMs show their strong visual capabilities when doing text-to-code or turning images into code. The dashboards API also makes it possible to turn JSON files into dashboards, and with an LLM and some code, we can turn images into a Kibana dashboard.
The next step is improving the flexibility of dashboard visuals by using different grid settings, dashboard sizes, and positions. Also, providing support for more complex visualizations and visualization types would be a useful addition to this application.
Ready to try this out on your own? Start a free trial.
Want to get Elastic certified? Find out when the next Elasticsearch Engineer training is running!
Related content

April 18, 2025
Kibana Alerting: Breaking past scalability limits & unlocking 50x scale
Kibana Alerting now scales 50x better, handling up to 160,000 rules per minute. Learn how key innovations in the task manager, smarter resource allocation, and performance optimizations have helped break past our limits and enabled significant efficiency gains.

March 3, 2025
Fast Kibana Dashboards
From 8.13 to 8.17, the wait time for data to appear on a dashboard has improved by up to 40%. These improvements are validated both in our synthetic benchmarking environment and from metrics collected in real user’s cloud environments.

Spotify Wrapped part 2: Data analysis and visualization
We will dive deeper into your Spotify data than ever before and explore connections you didn't even know existed.
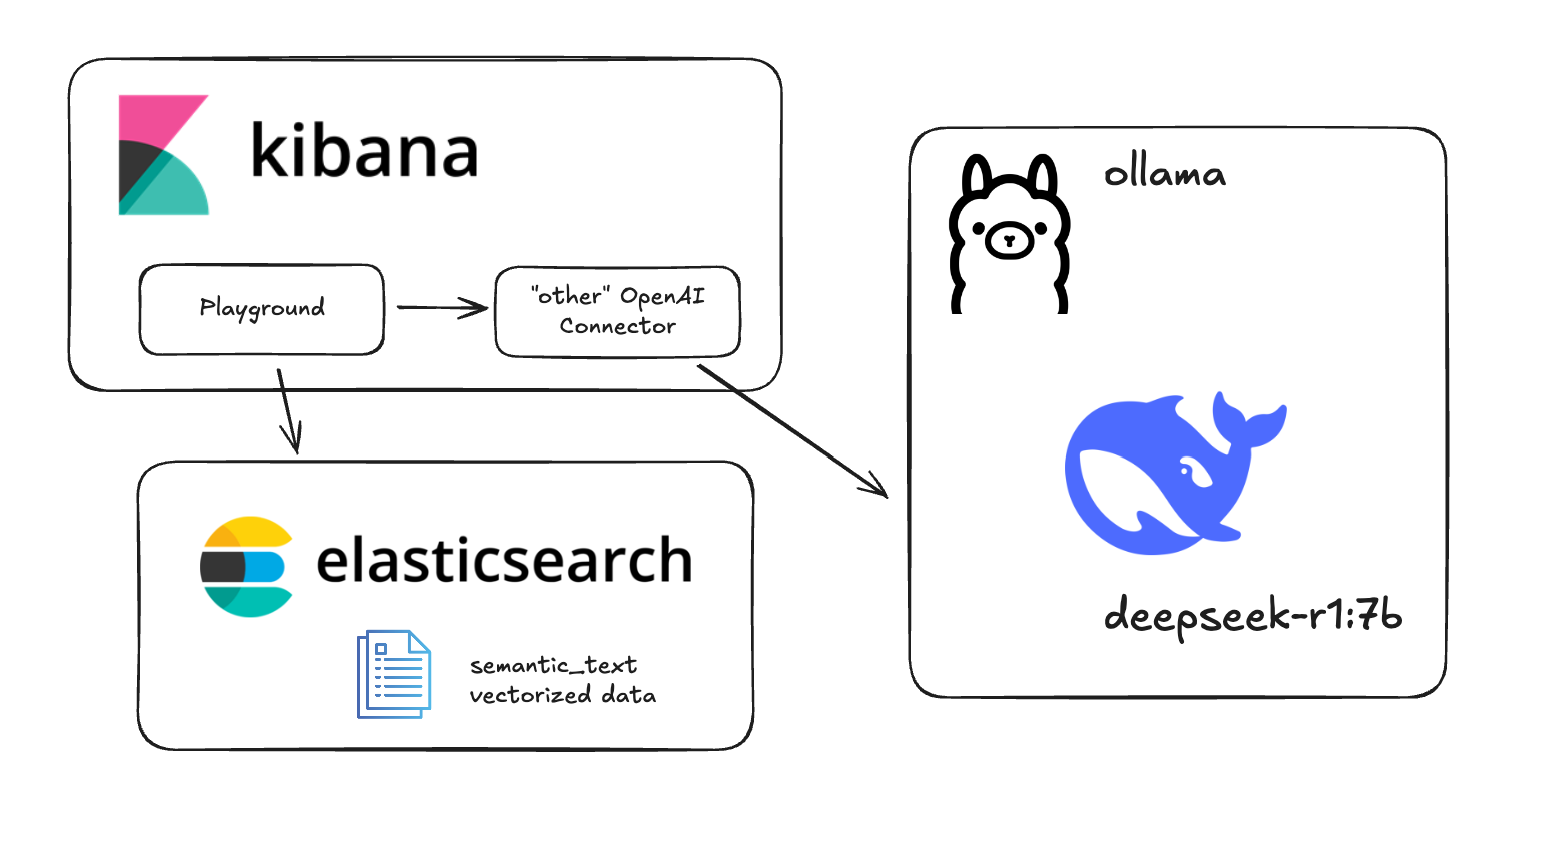
Testing DeepSeek R1 locally for RAG with Ollama and Kibana
Learn how to run a local instance of DeepSeek and connect to it from within Kibana.

January 22, 2025
Engineering a new Kibana dashboard layout to support collapsible sections & more
Building collapsible dashboard sections in Kibana required overhauling an embeddable system and creating a custom layout engine. These updates improve state management, hierarchy, and performance while setting the stage for new advanced dashboard features.