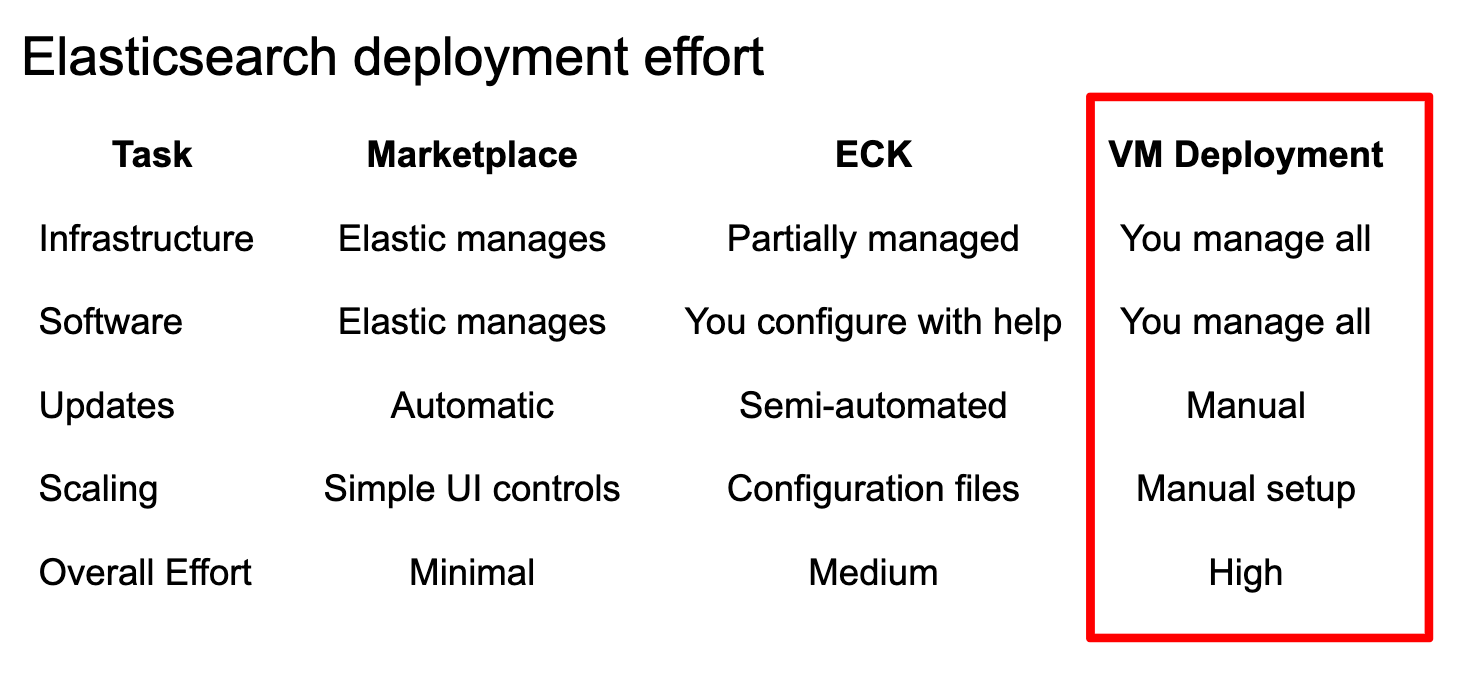
This blog will guide you through setting up an Elasticsearch deployment on a Google Compute Engine virtual machine instance, along with Kibana for data visualization and interaction. By following these steps, you'll learn to manually manage and configure your Elasticsearch environment on Google Cloud. This approach requires you to manually handle infrastructure, software installation, updates, and scaling.
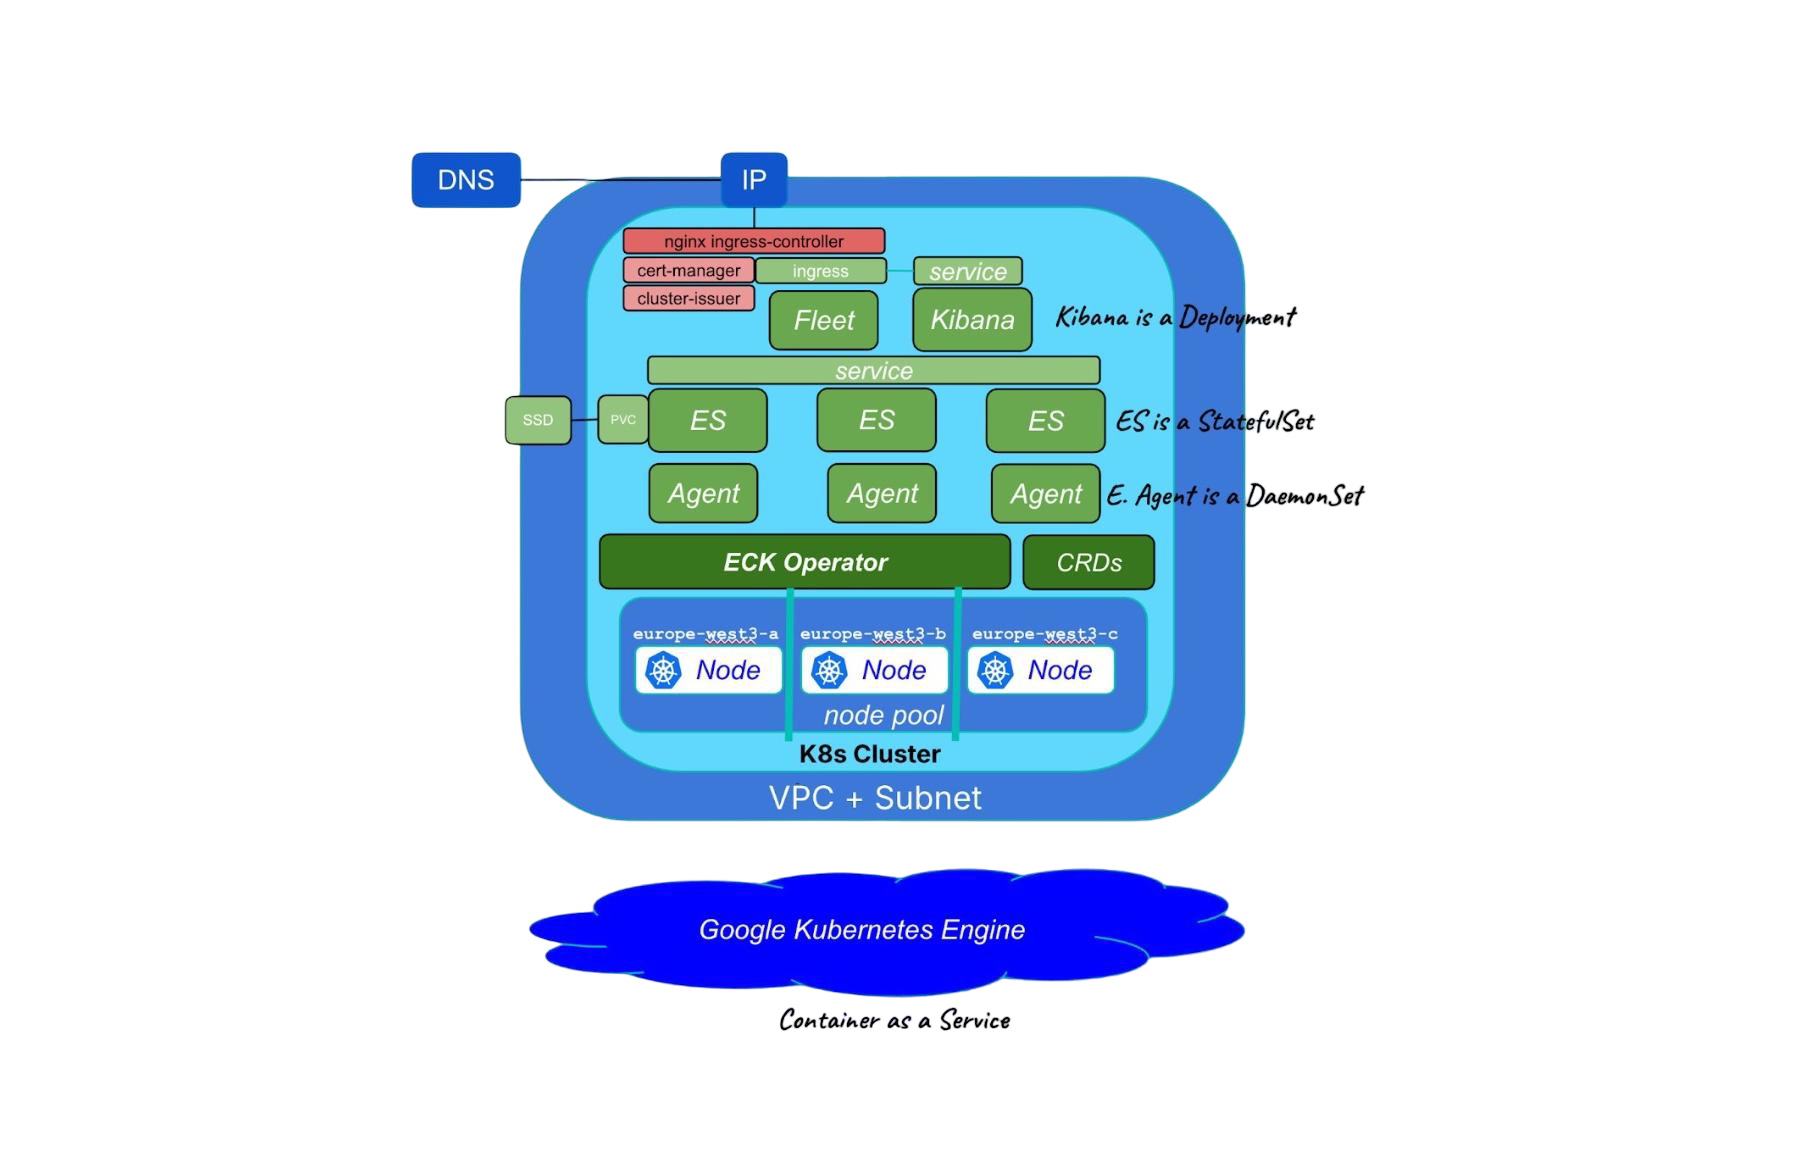
For something in the middle, you could use Elastic Cloud Kubernetes (ECK) which provides tools to scale with ease but also a steeper learning curve. You can learn about ECK + GKE Autopilot in here and about Google Cloud Marketplace Elastic Cloud in a future article. Stay tuned!
When to use Elasticsearch in Google Compute Engine?
Deploying Elasticsearch on a Virtual machine running in Google Cloud is generally advisable when you need to isolate the Elasticsearch environment, manage resources efficiently, or when you want to run it alongside other applications on a single host. This requires handling infrastructure, software, updates and scaling manually.
Setting up a virtual machine Instance
In this blog, we’re going to work with Google Cloud console. All the steps can also be performed on the command line. For more information, access Google Cloud documentation.
1. Log in to Google Cloud
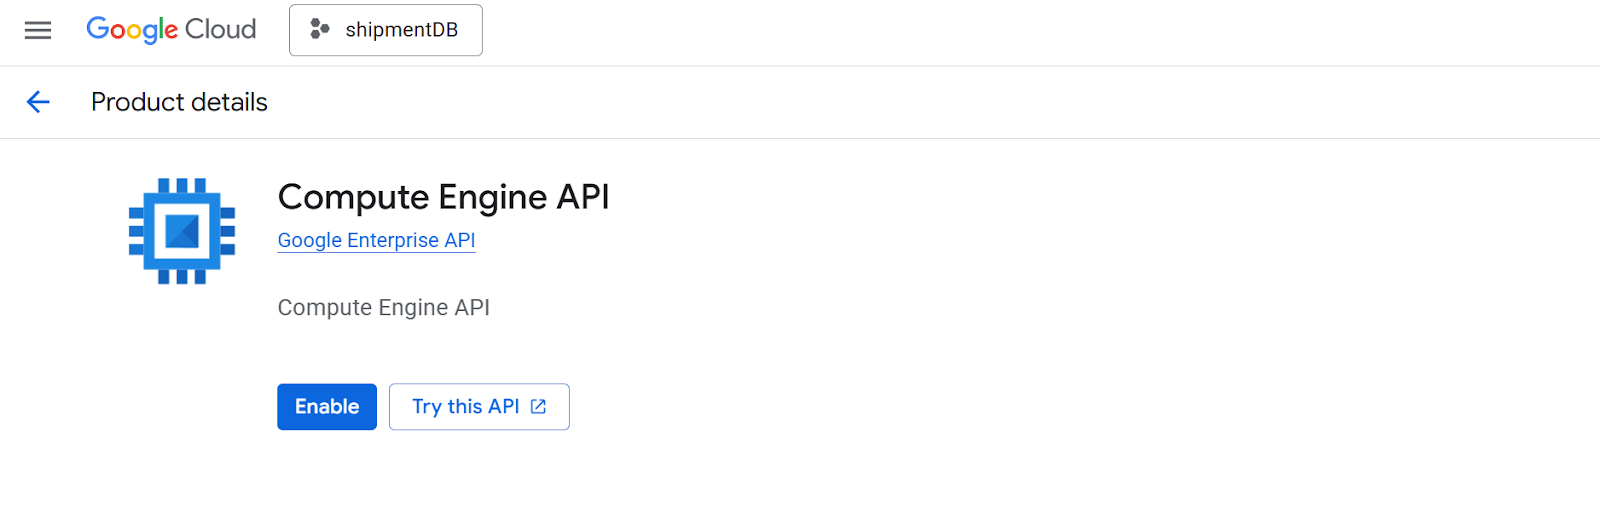
2. Click on Create a VM
3. Note: If it is the first time you run this action, it is required to enable the Compute Engine API. For this, click the Enable button
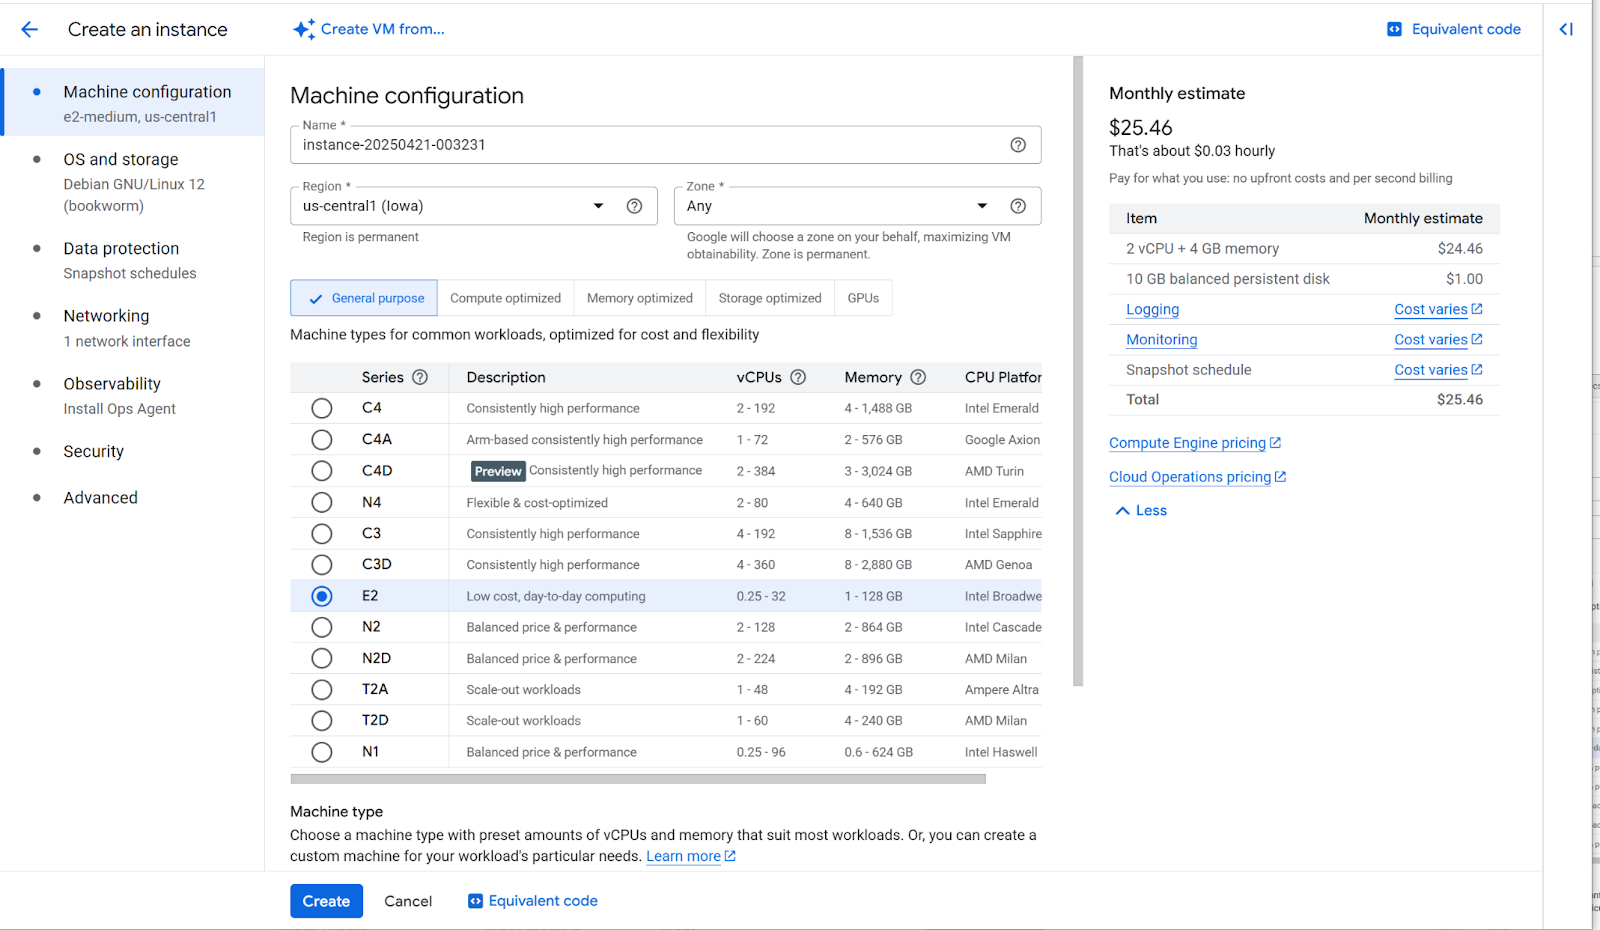
4. Machine configuration. Now, we'll configure the basic specifications for our virtual machine:
- Name: gcp-setup
- Region: us-central1 (default)
- Zone: Any
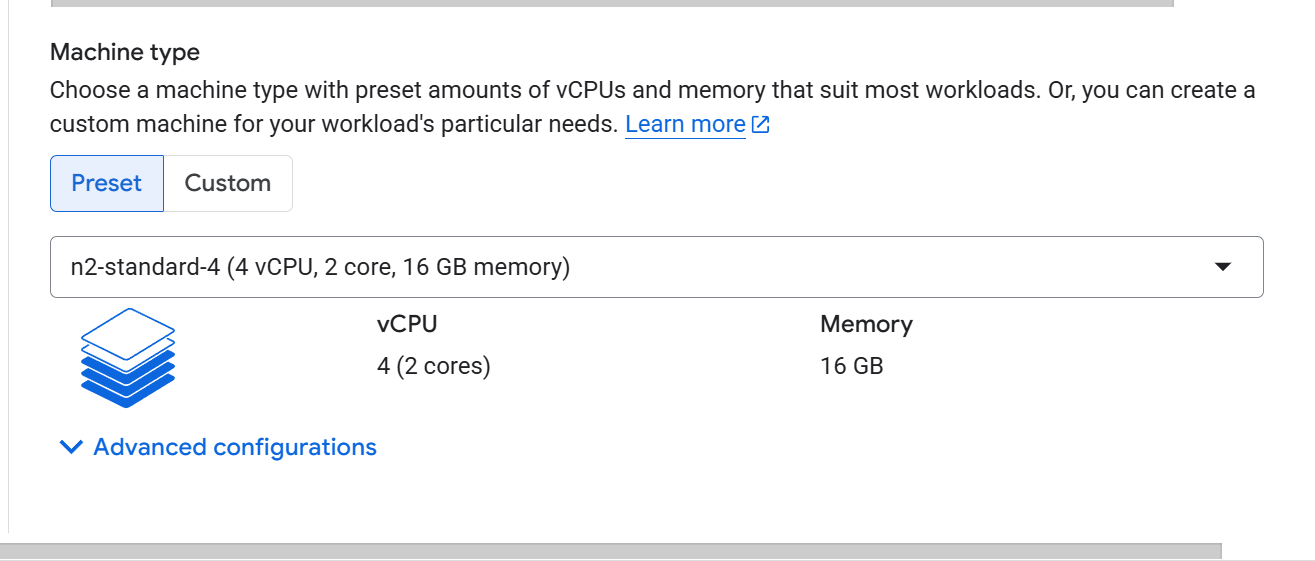
- Machine type: The configuration depends on the performance required for this deployment. For this example, we’re using e2-medium (2 vCPU, 1 core, 4GB memory).
5. OS and storage:
- Size: 10 GB (default)
- Image: Debian GNU/Linux (default)
6. Data protection. Default configuration
7. Networking: Default configuration
8. Observability: Default configuration
9. Security: Default configuration
10. Advanced: Default configuration
11. Click on Create

12. After creating the VM instance, you’ll be redirected to the VM instance page. The recently created instance will be shown in the VM instances table.
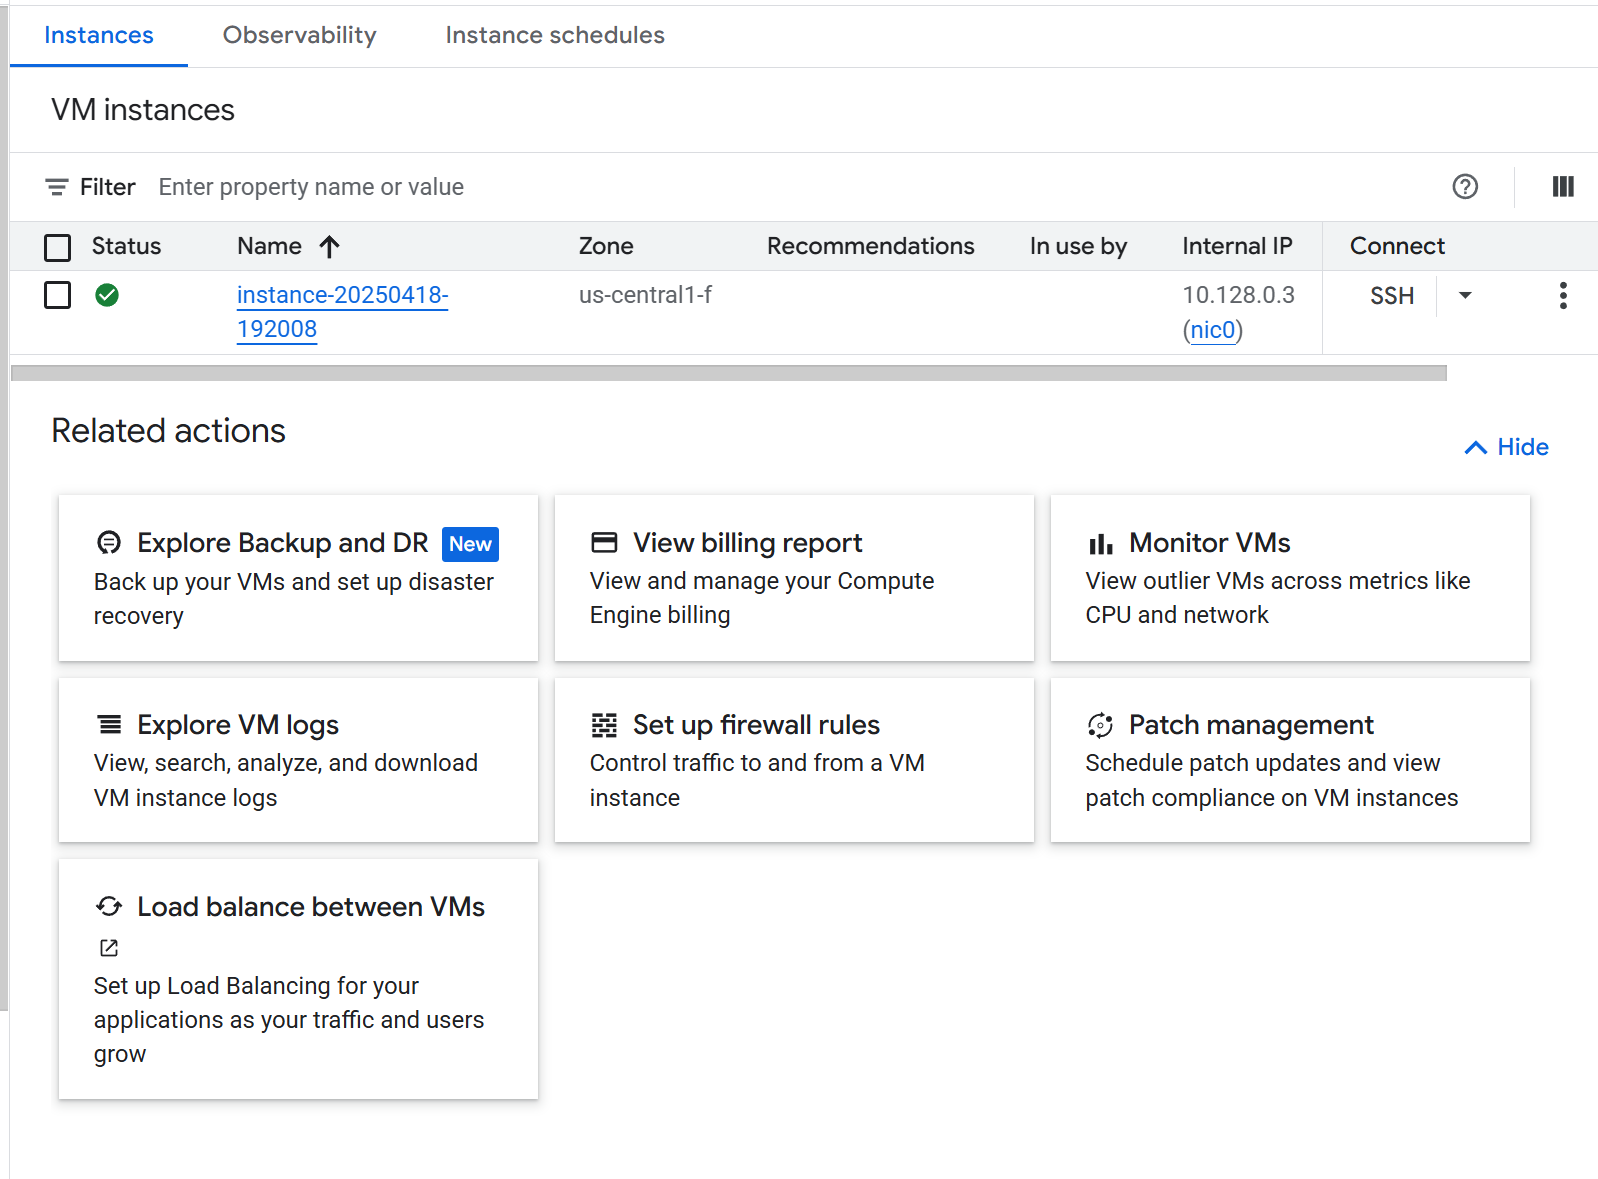
Configure internet access to Kibana
To connect to Kibana from the internet, we need to open the port in the recently created instance:
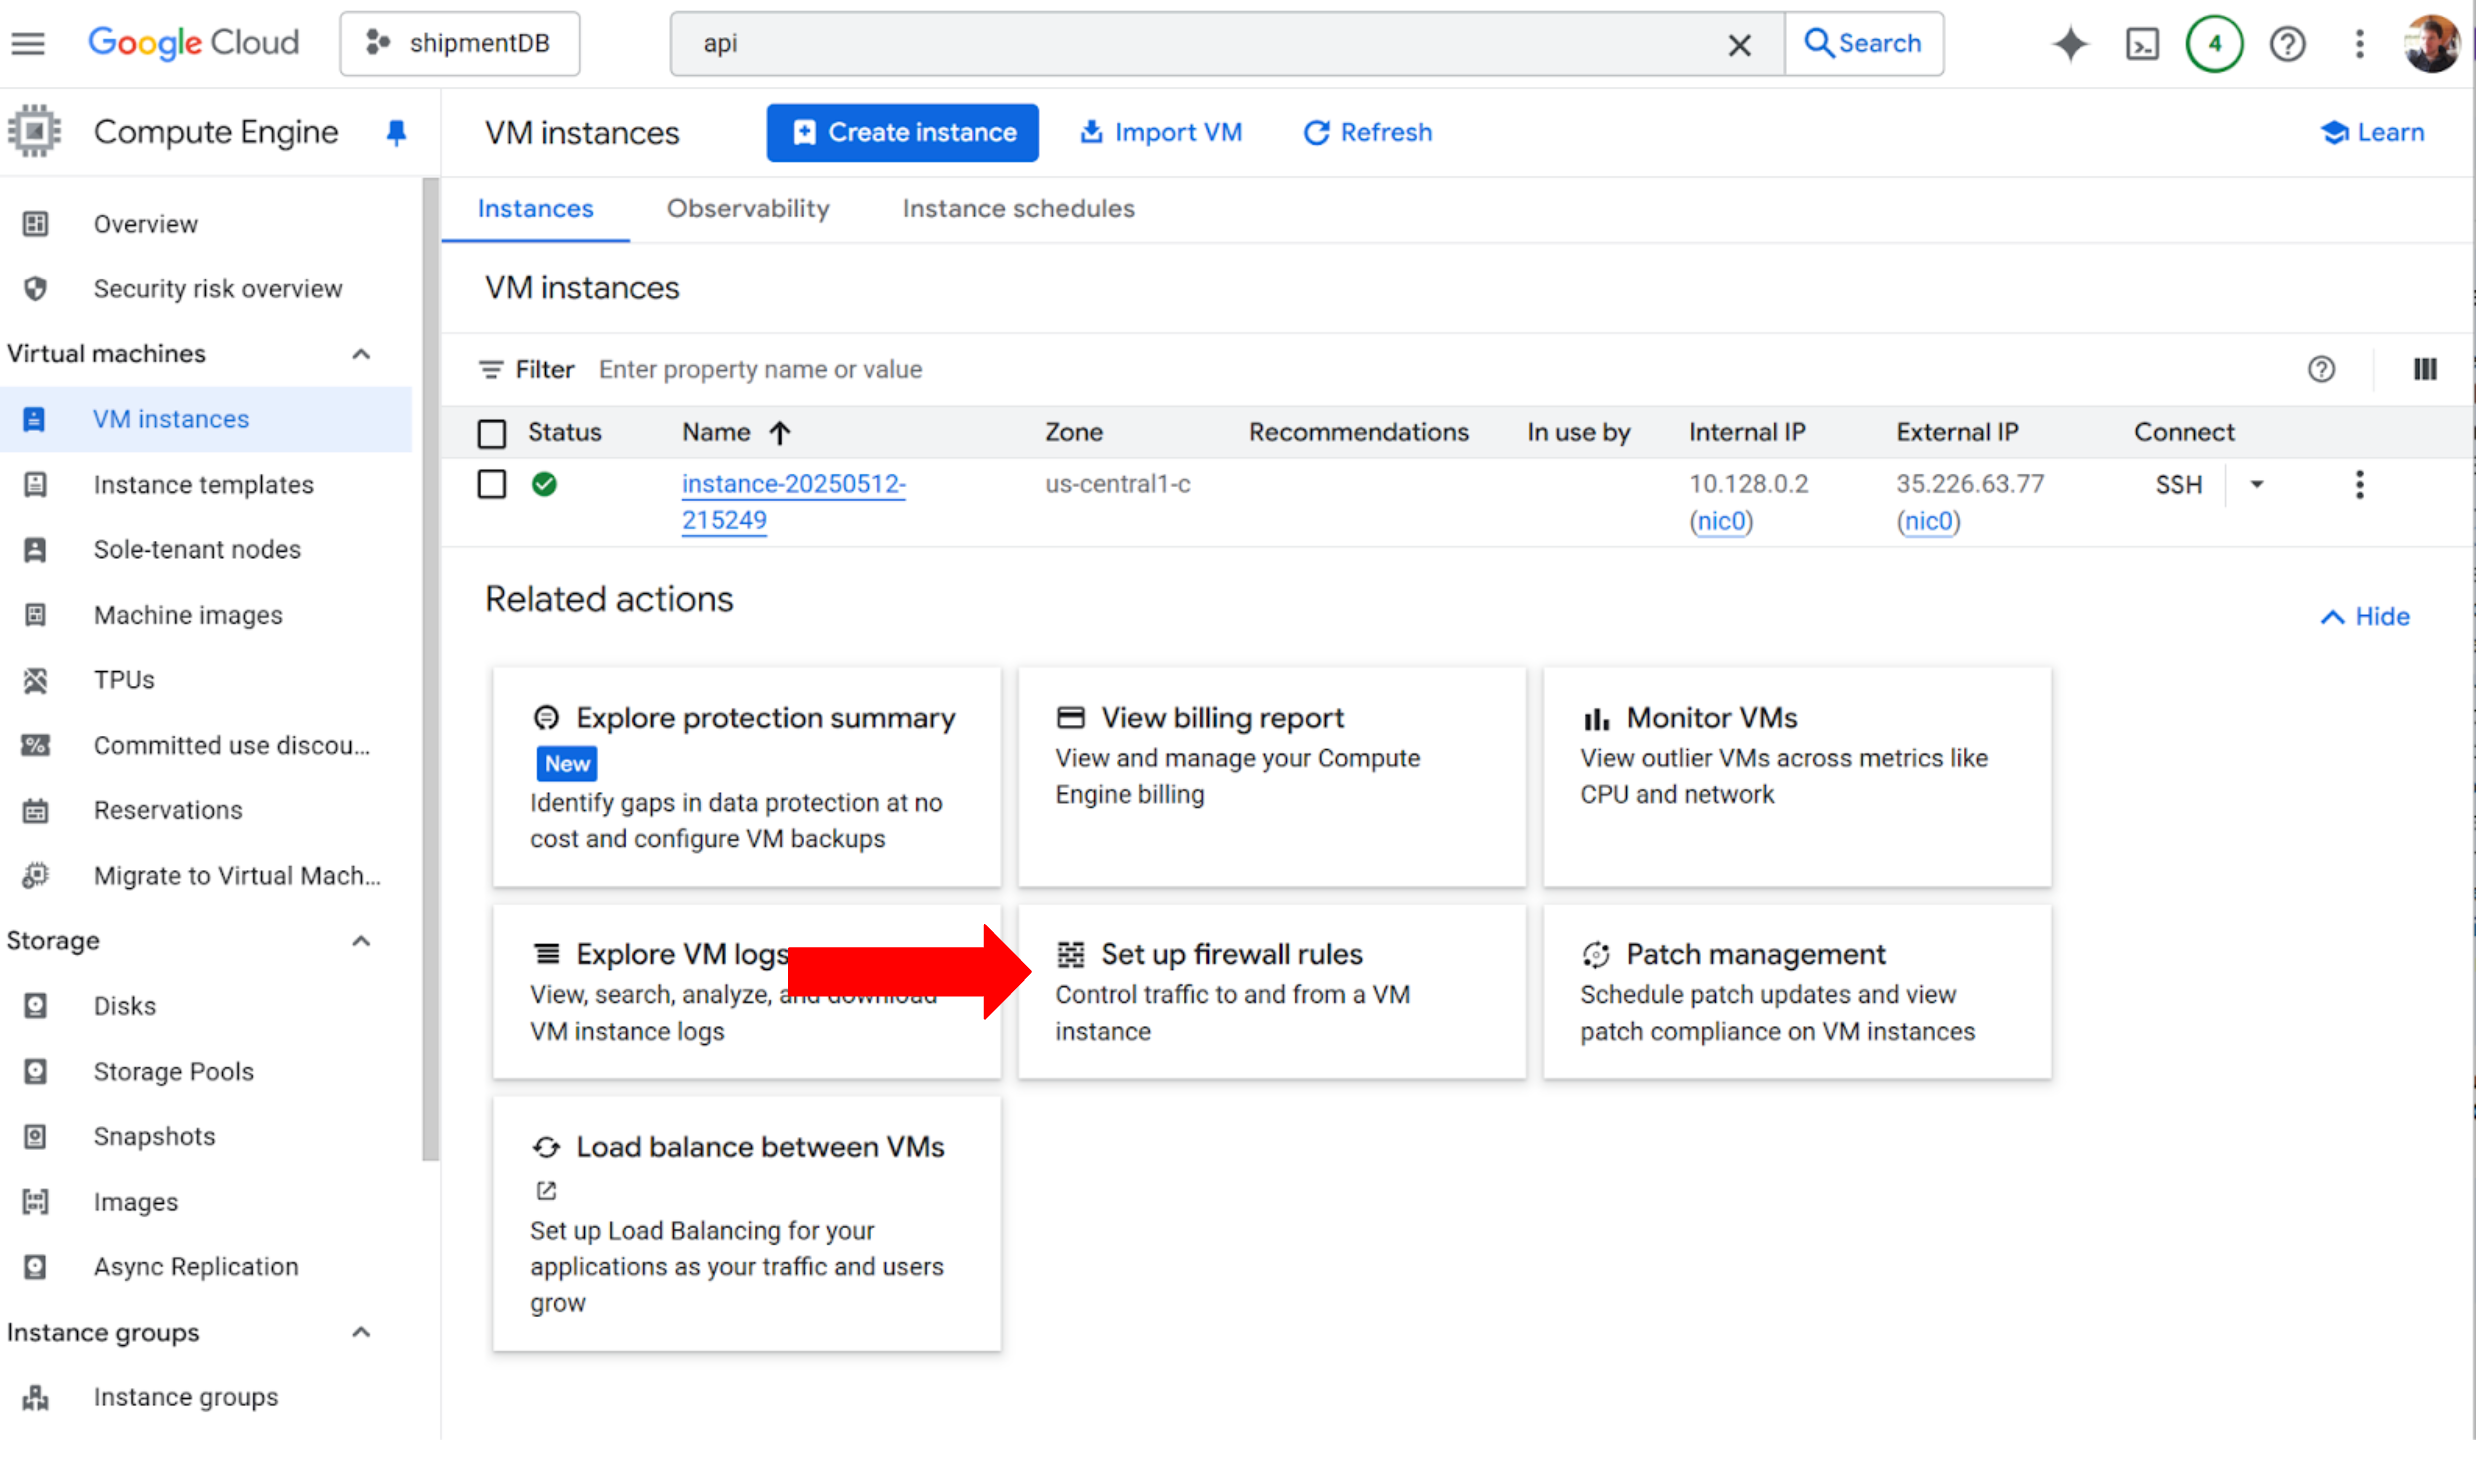
1. By default all ports are blocked, so the recently created VM instance doesn’t have internet access. Because of this, we need to open Elasticsearch’s ports. From the instance's previous view, click Set up firewall rules under Related actions.
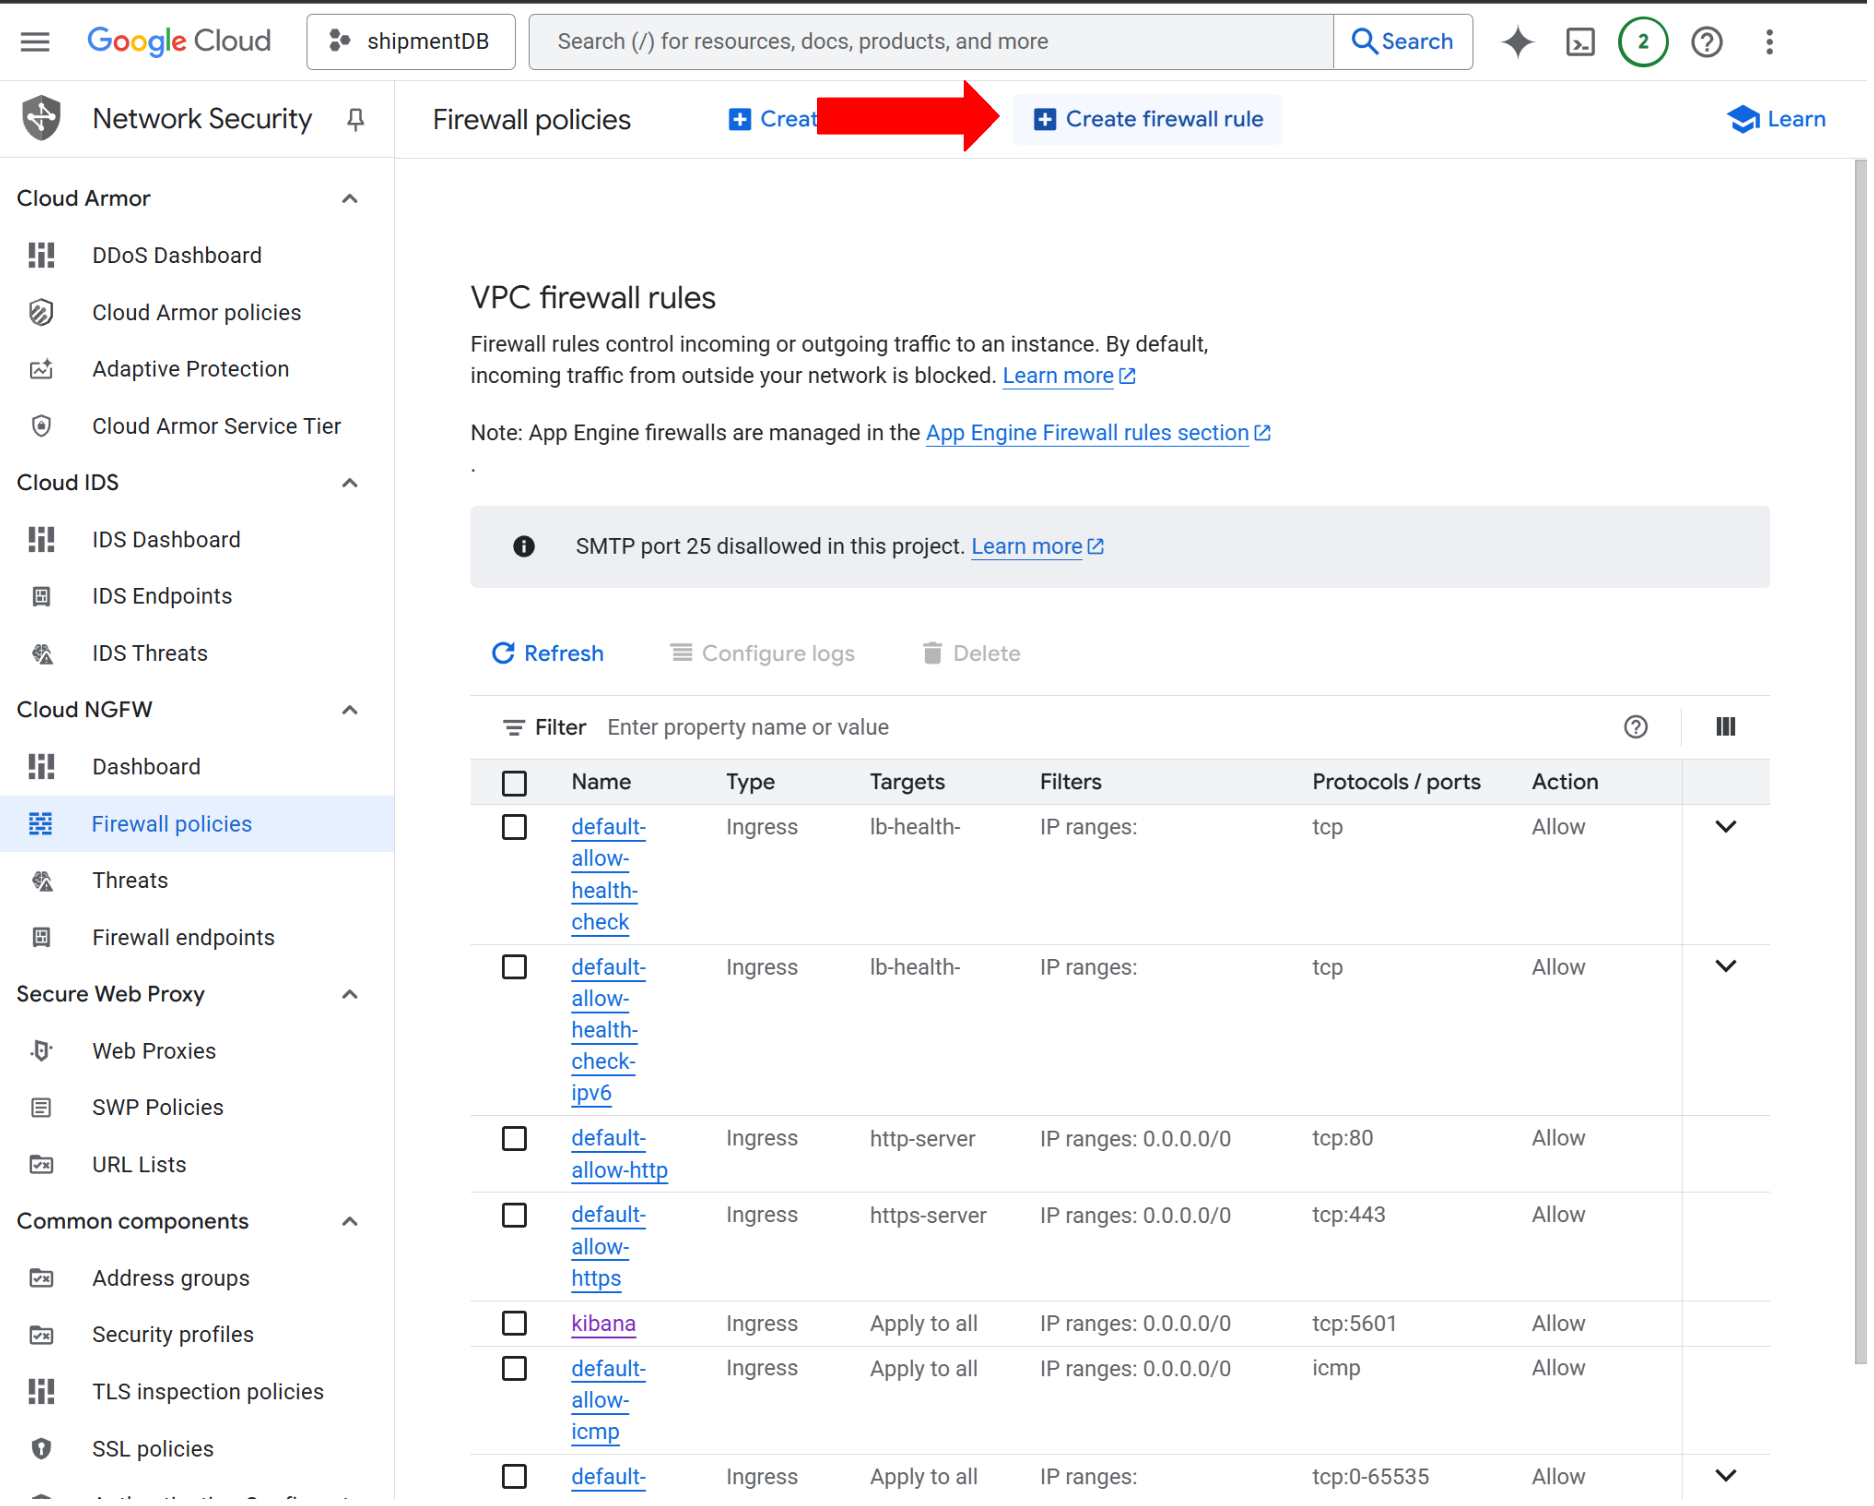
2. Click on Create firewall rule:
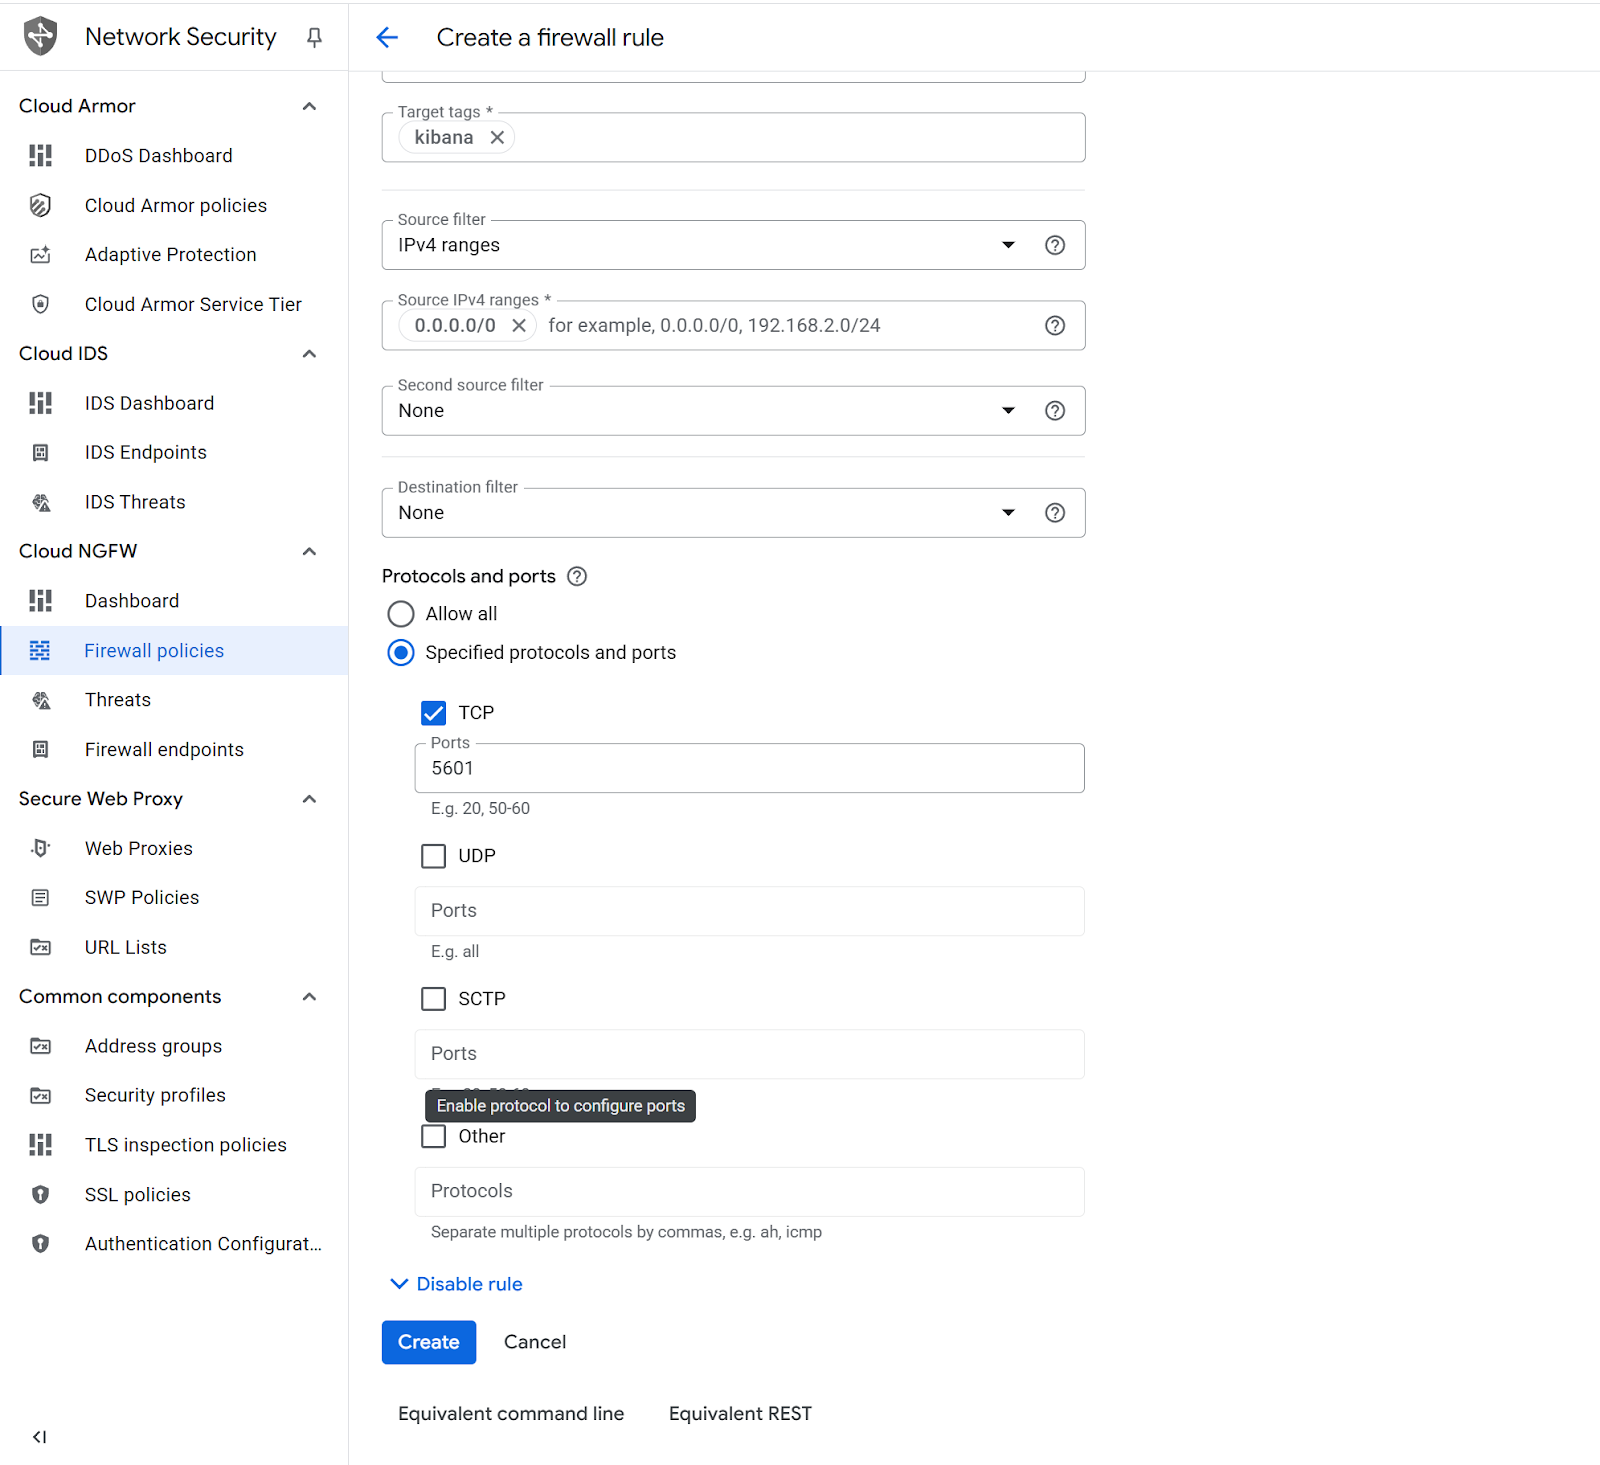
3. Configure the firewall rule:
- Name: allow-kibana
- Logs: Off
- Network: default
- Priority: 1000
- Direction of traffic: Ingress
- Action on match: Allow
- Targets: Specified target tags
- Target tags: kibana
- Source filter: IPv4 ranges
- Source IPv4 ranges: 0.0.0.0/0
- Second source filter: None
- Destination filter: None
- Protocols and ports: Specified protocols and ports
- Check on TCP, Ports: 5601
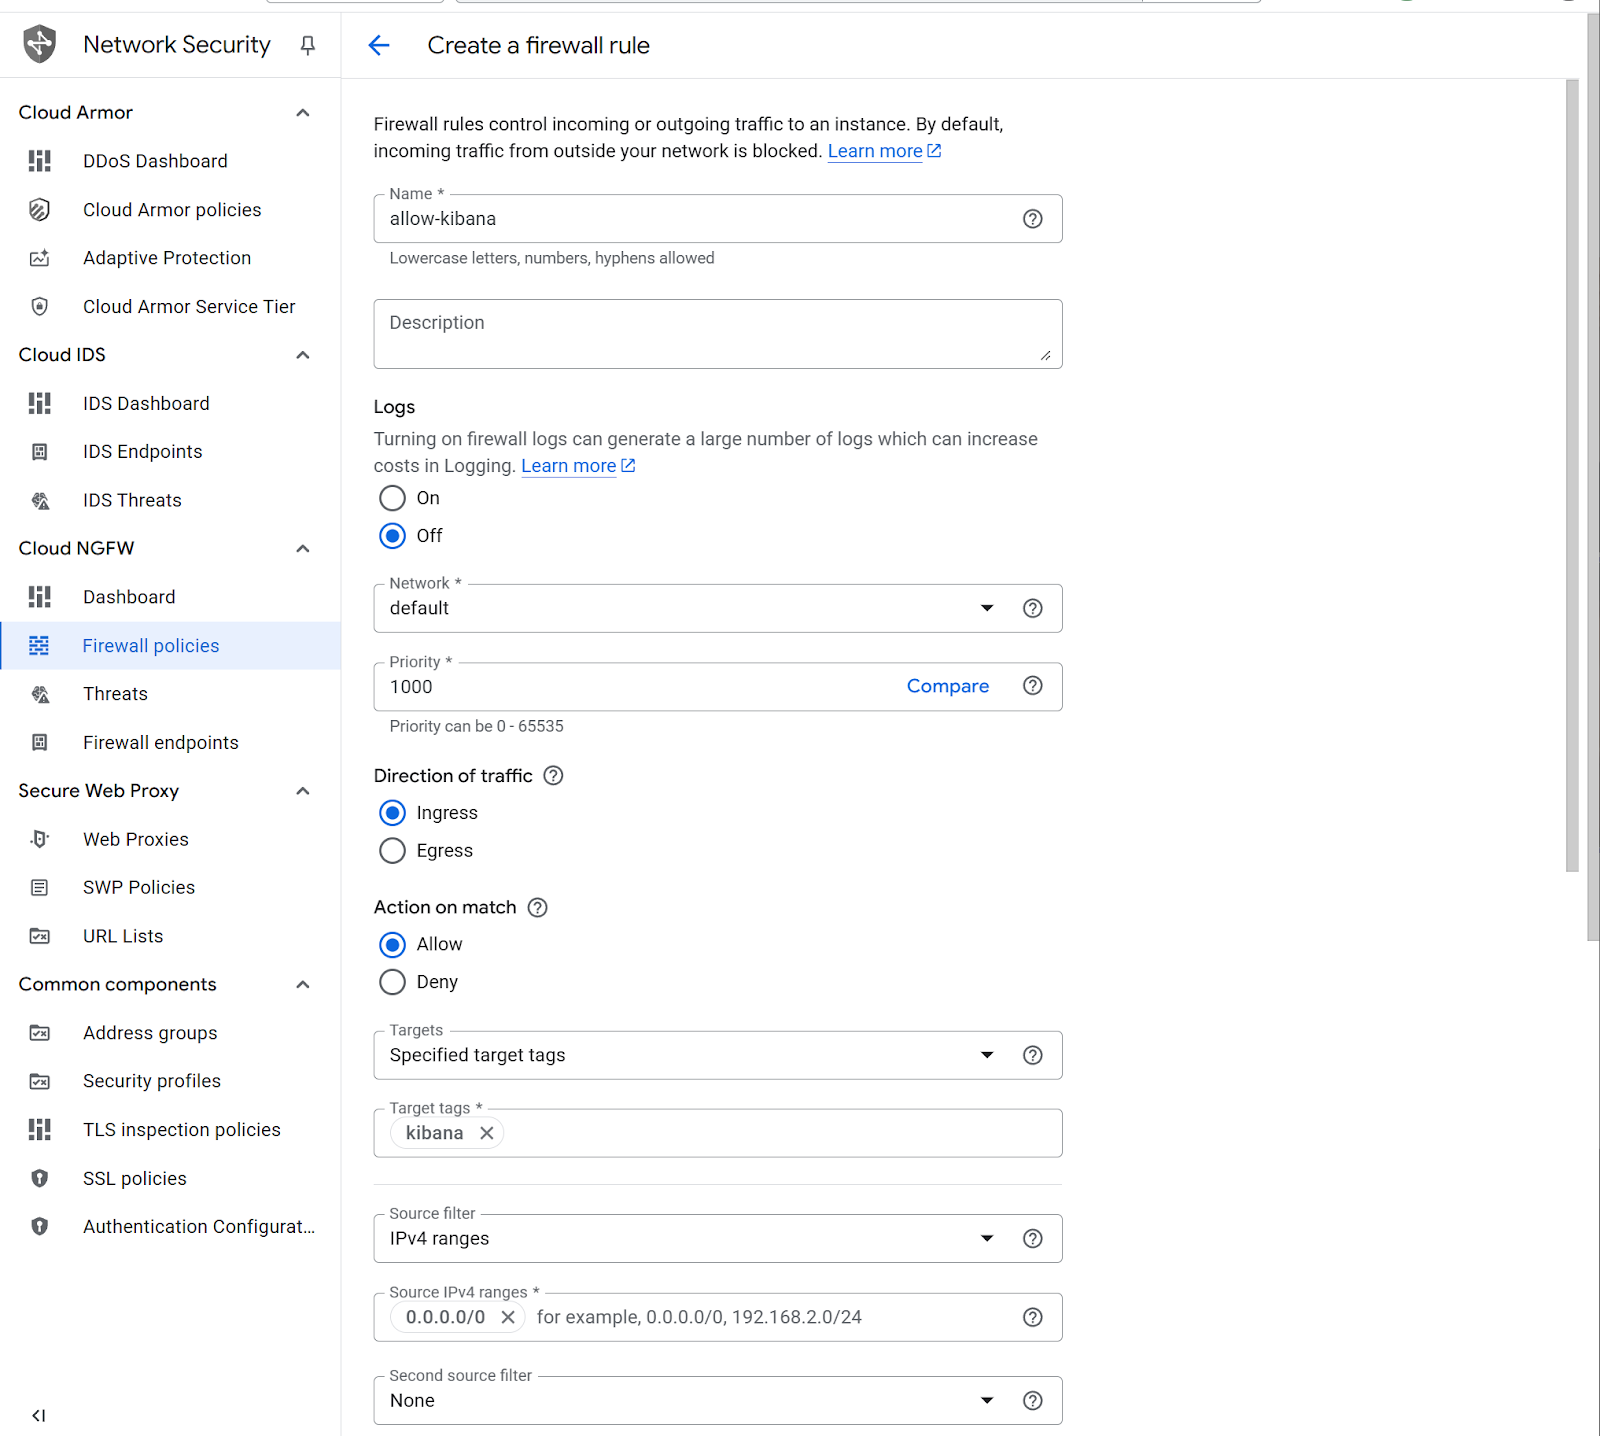
Then click the Create button.
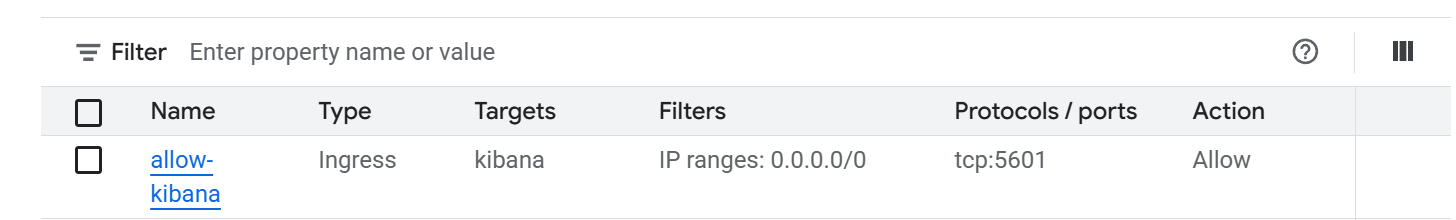
Confirm the VPC firewall rule is in place.
Connect to Virtual Machine
1. Go to Compute Engine VM instances and Connect SSH
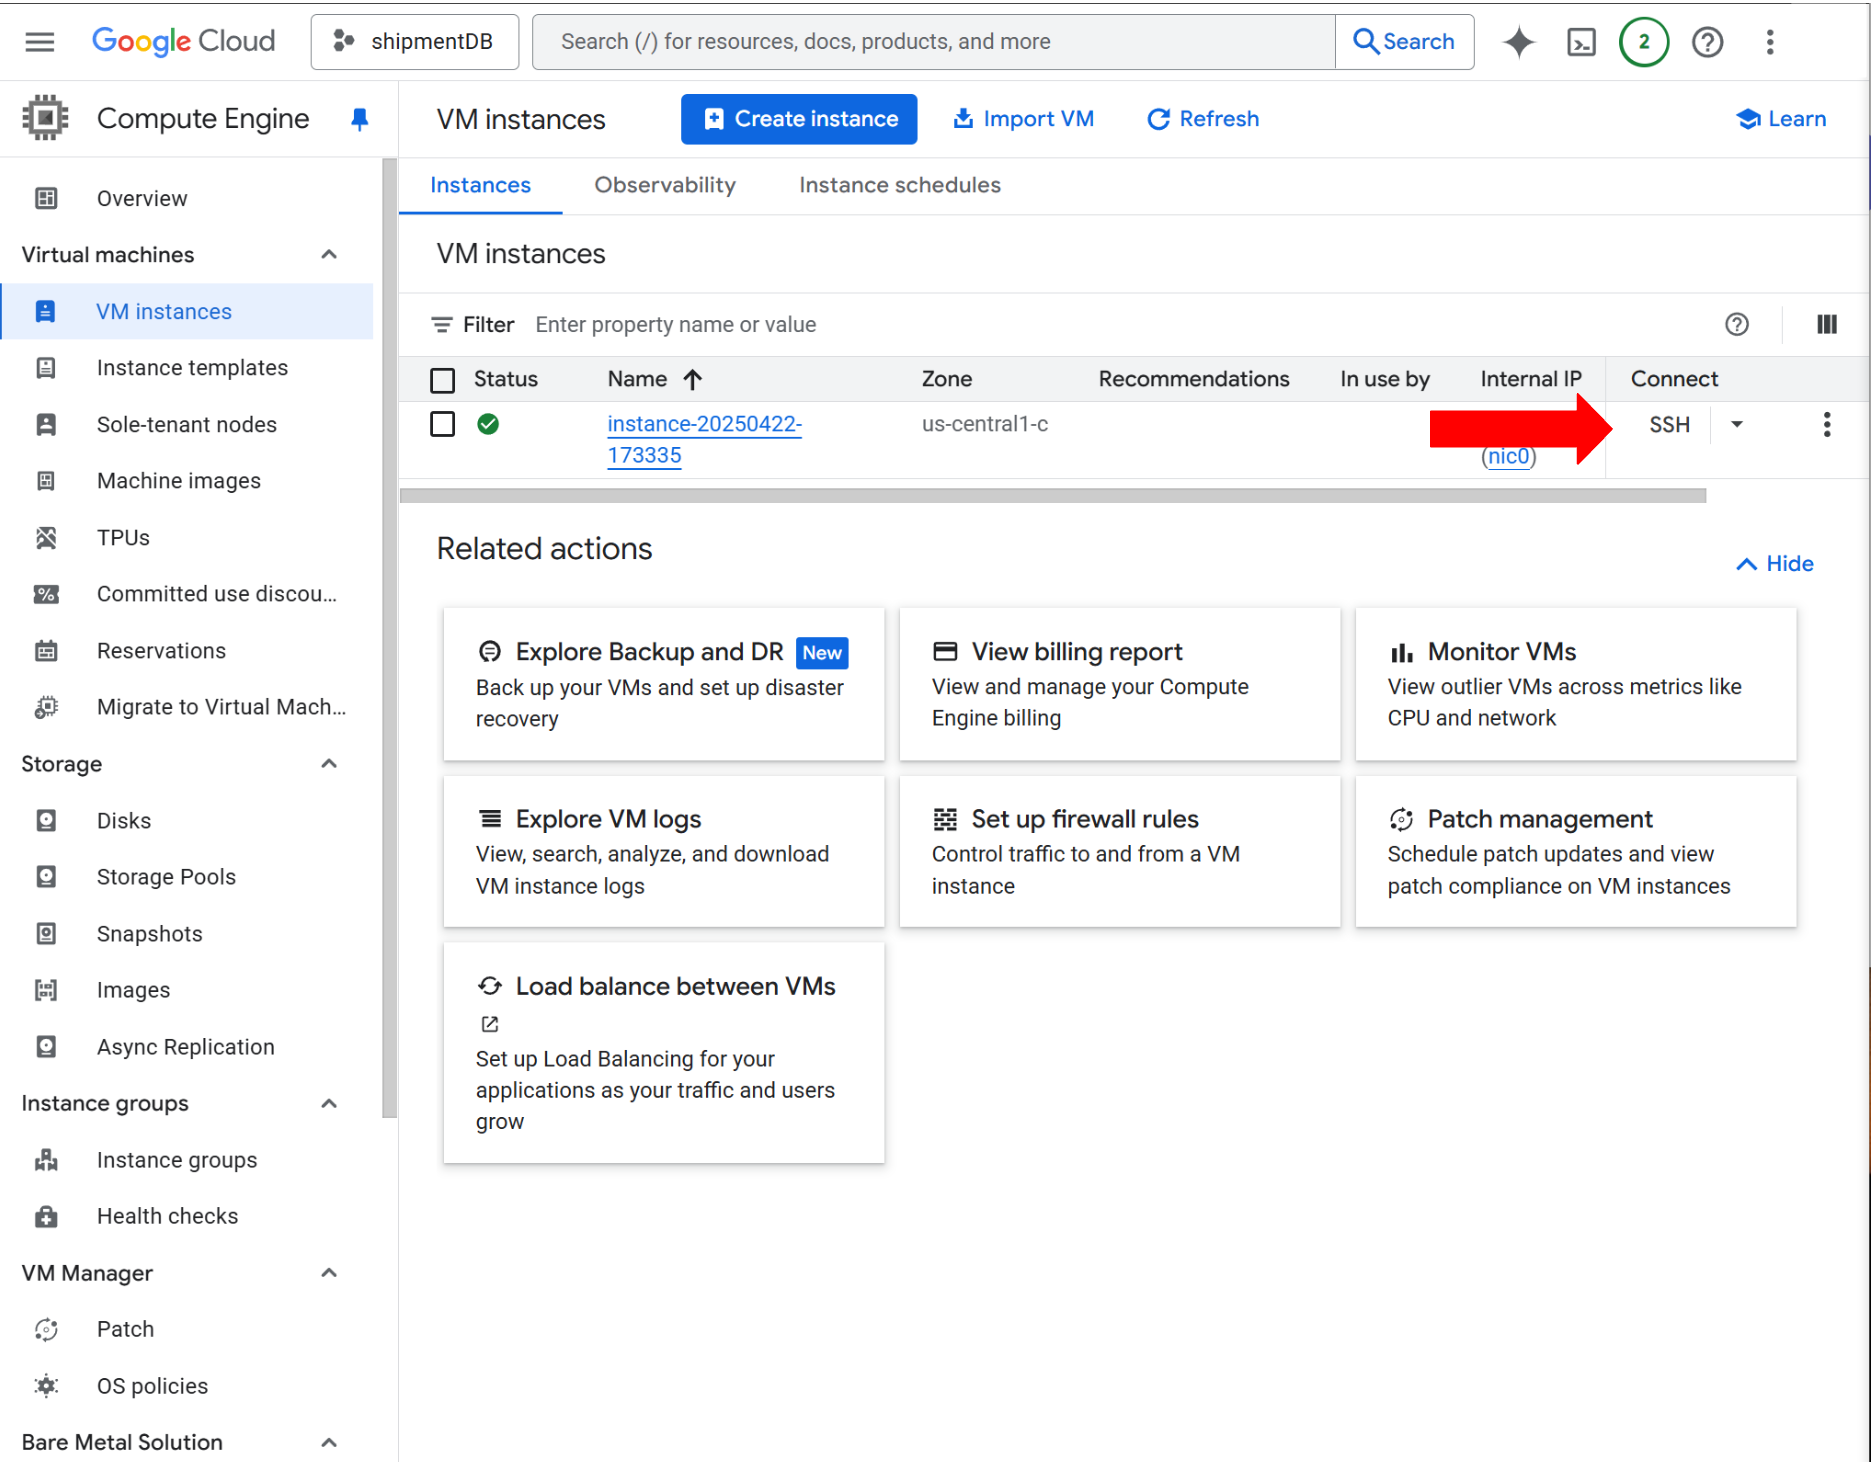
2. Click on recently created instance Connect SSH.
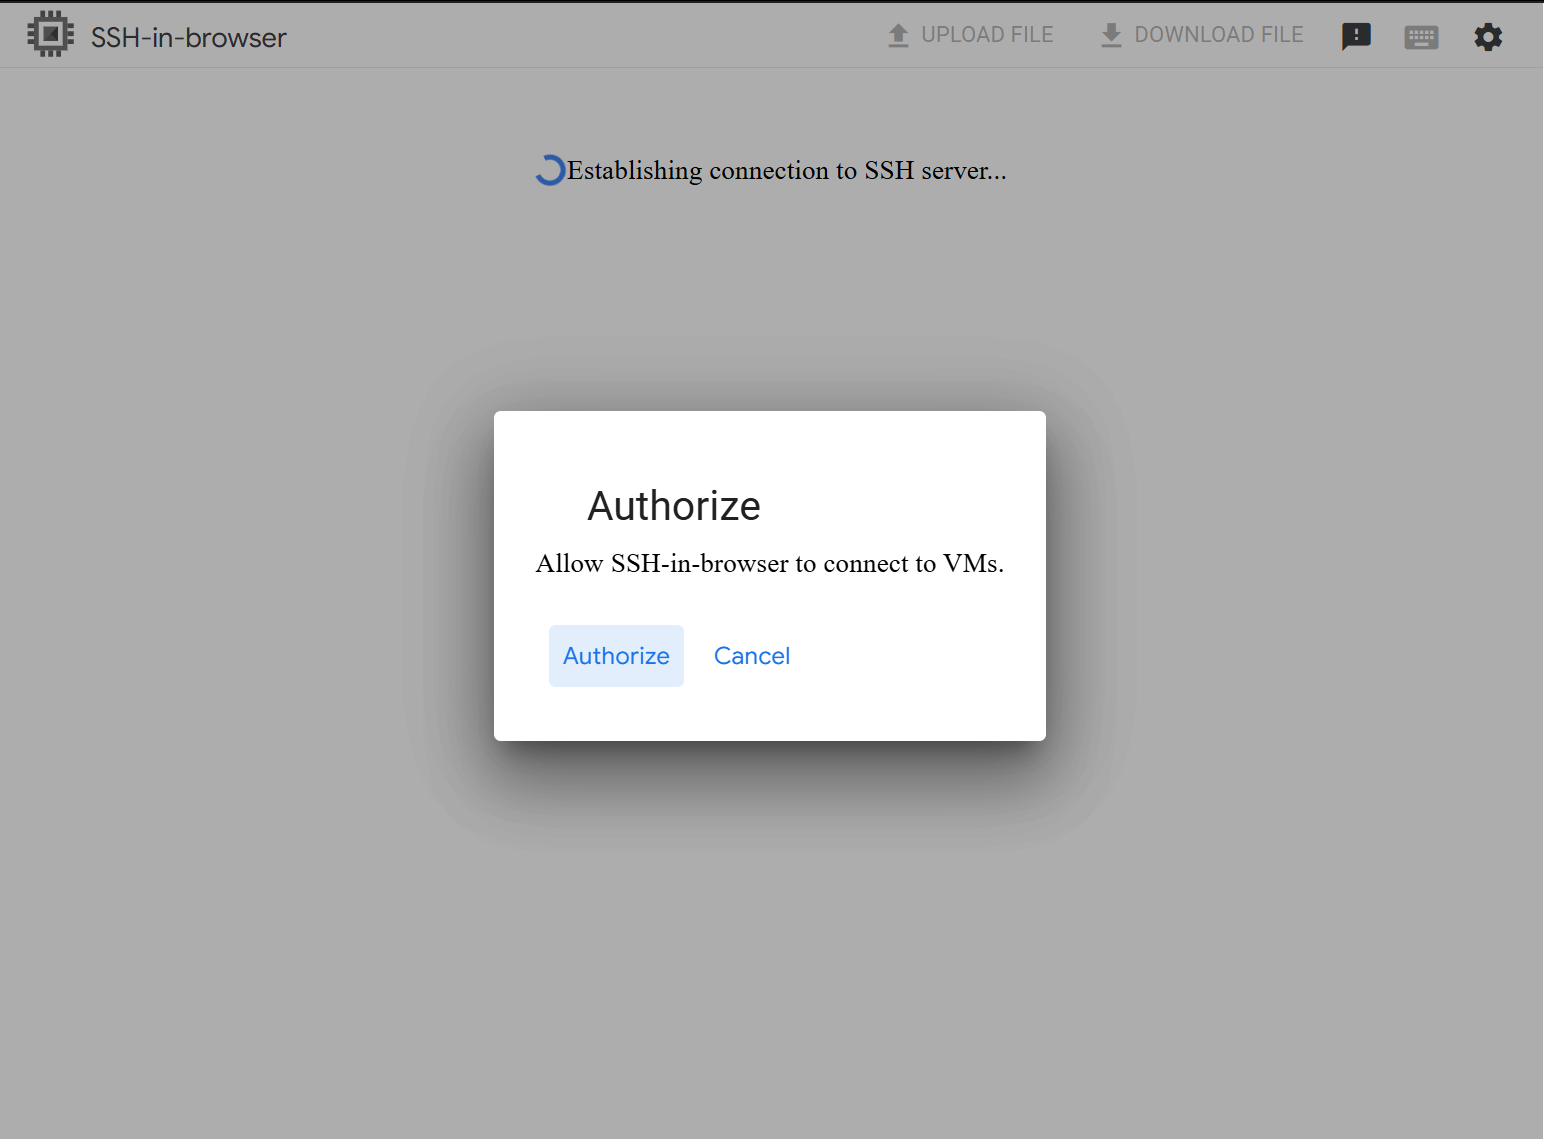
3. A pop-up window will appear. Authorize SSH-in-browser. Click on the Authorize button.
Note: If you use a pop-up blocker, enable it for Google Cloud.
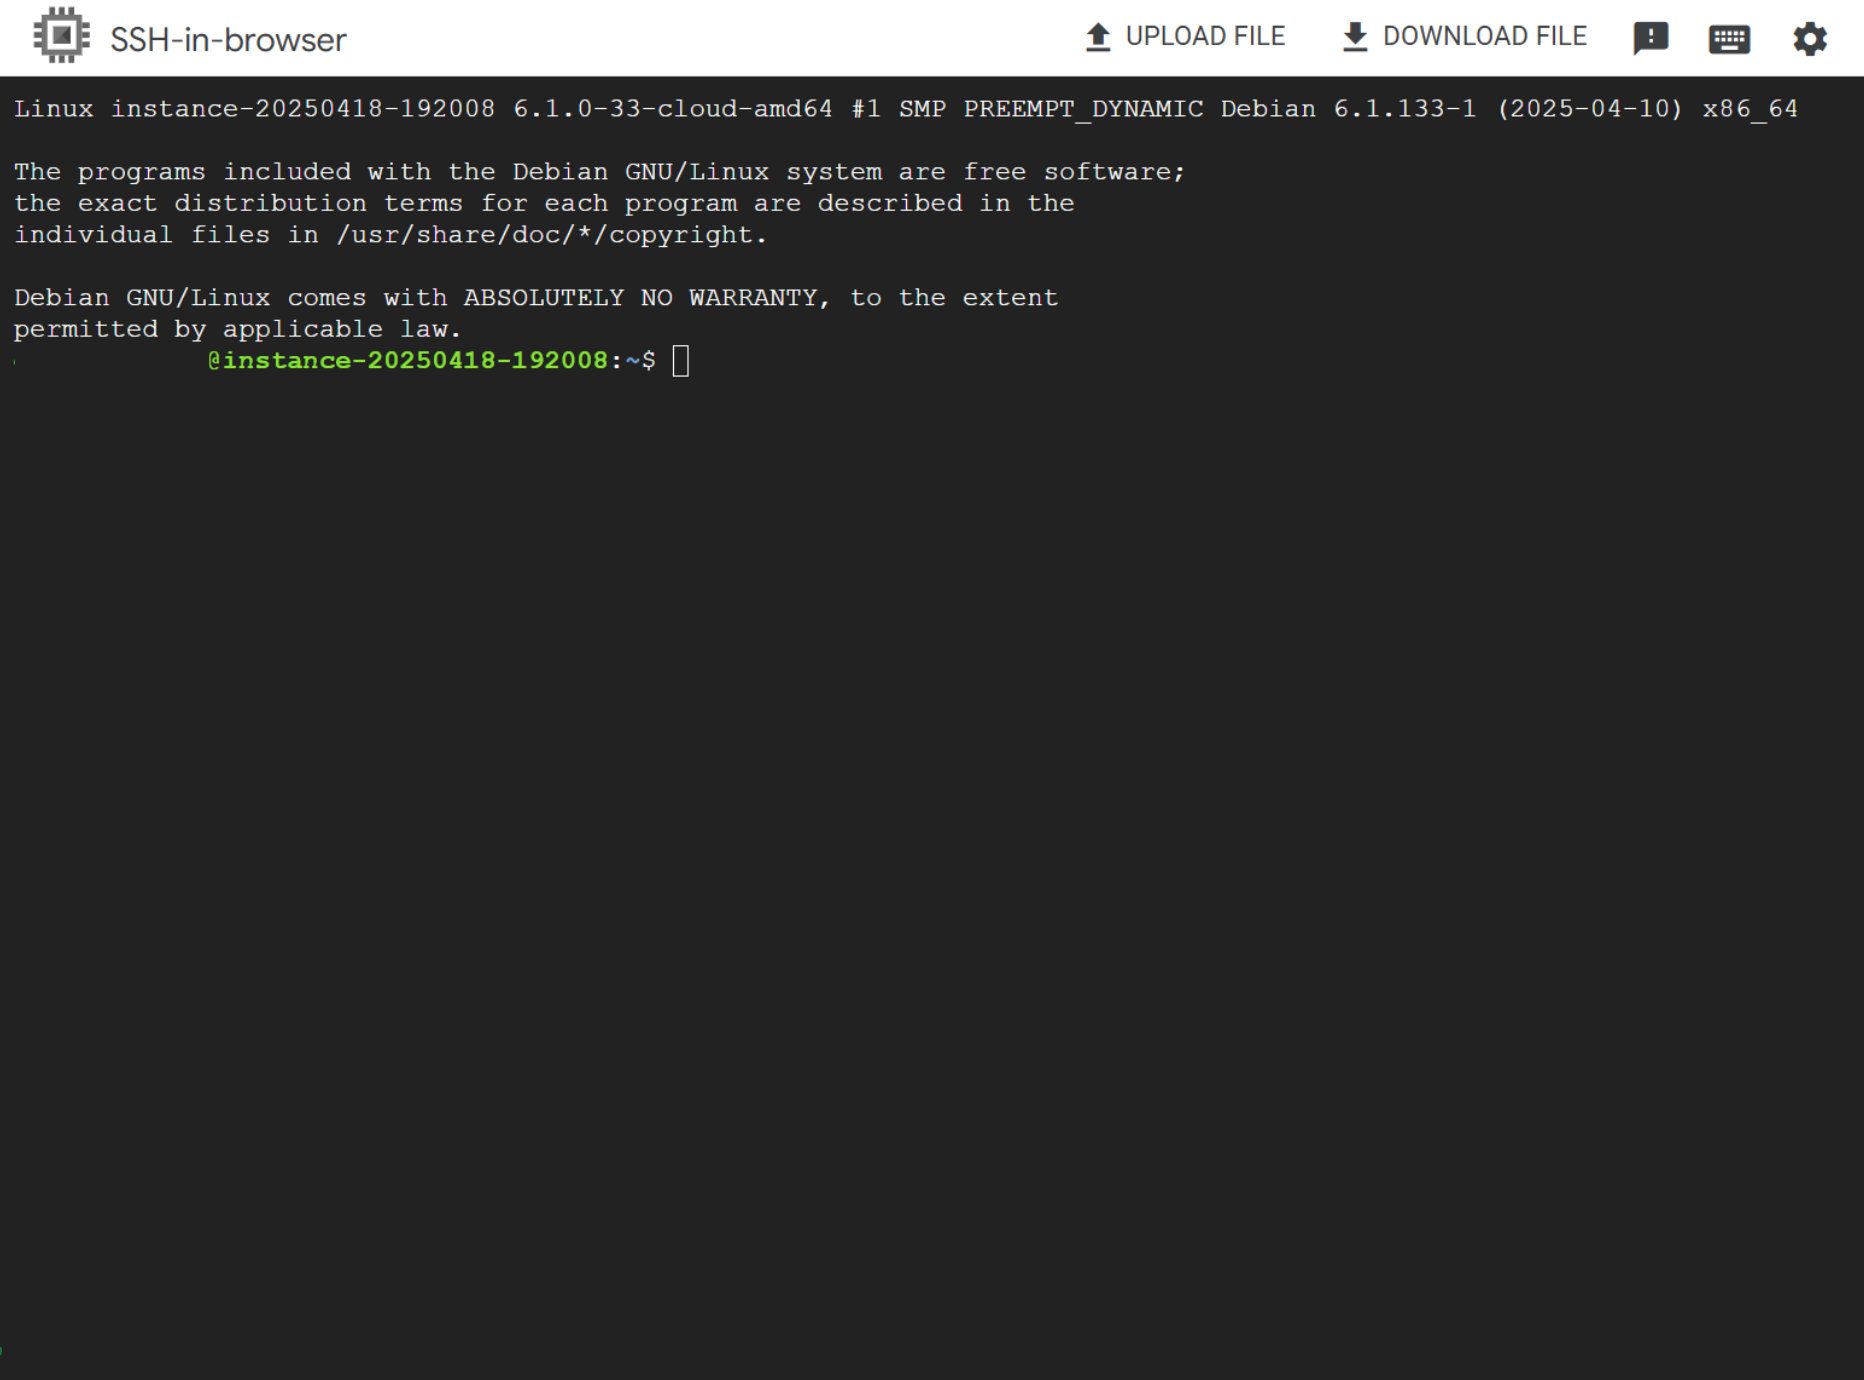
4. Now we’re in the Instance console.
Installing Elasticsearch
This section includes information on how to set up Elasticsearch and get it running.
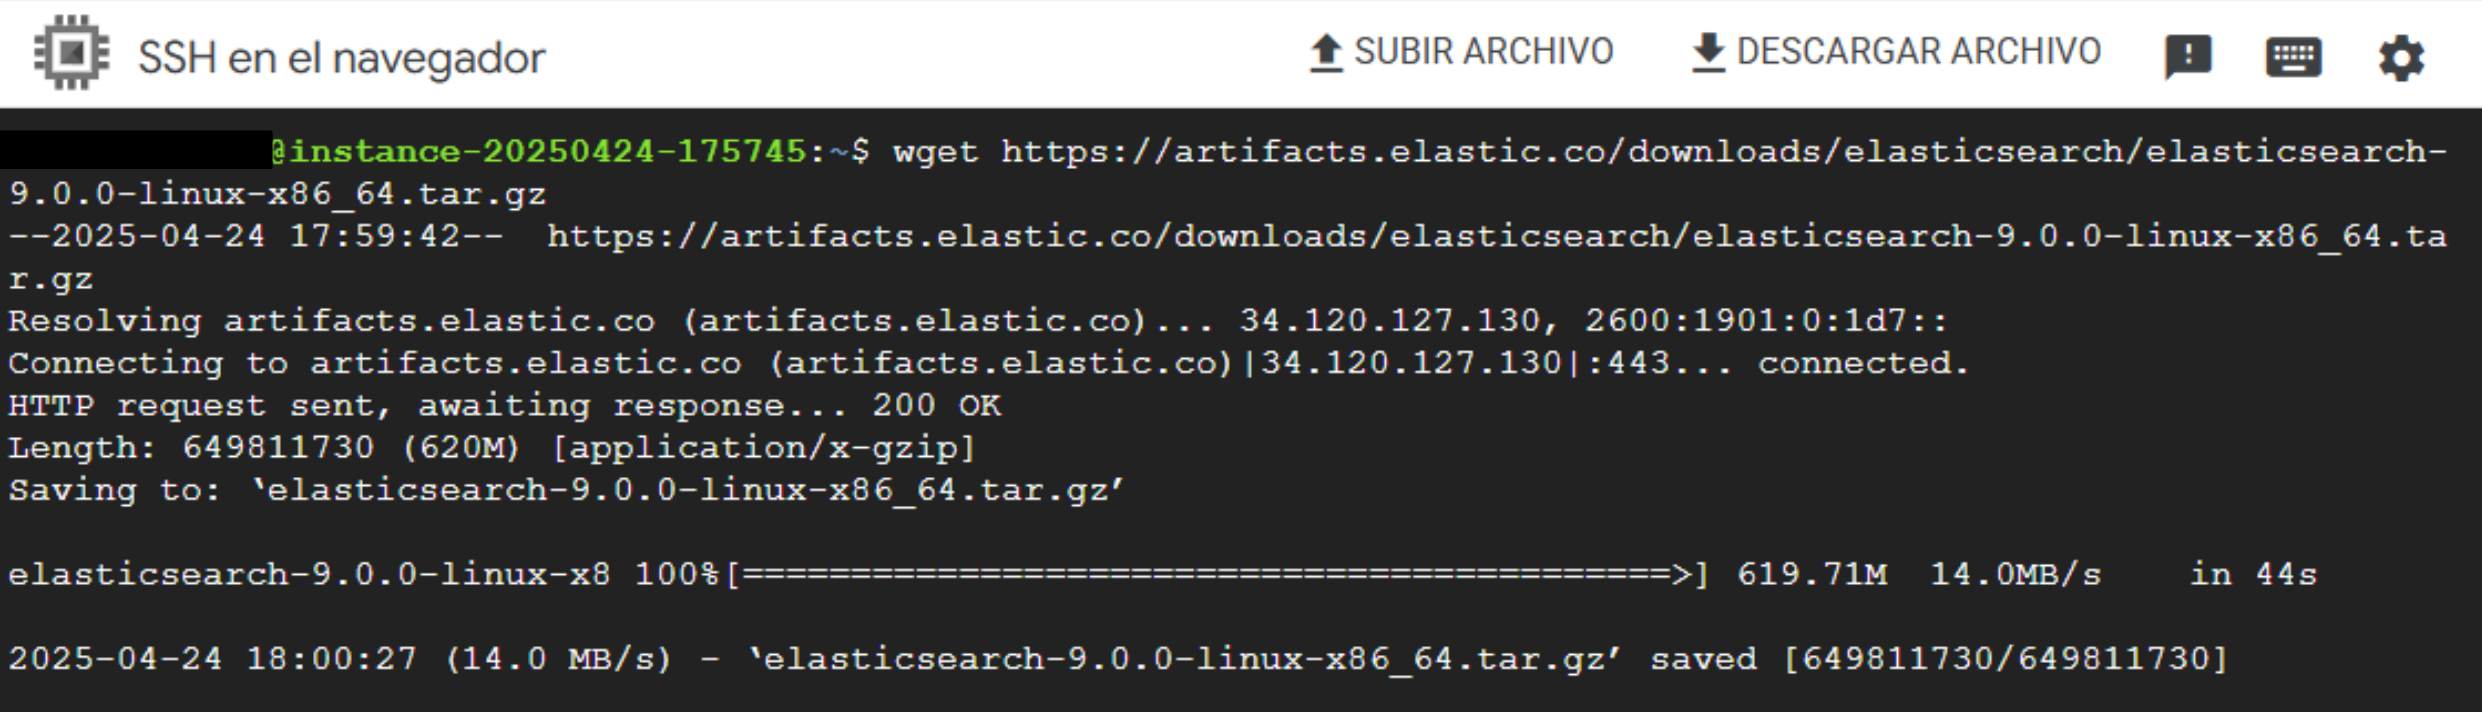
1. We download both the .tar.gz file (which contains the Elasticsearch software) and the .sha512 file (which contains the official checksum) to ensure we can verify the integrity of the software package.
Download the latest Elasticsearch version and verify its integrity.
The shasum command verifies file integrity by checking cryptographic hashes. It's used here to confirm the downloaded Elasticsearch package hasn't been corrupted or tampered with by comparing its SHA-512 hash against the official checksum from Elastic.
Note: If shasum command is not found, install it:
-bash: shasum: command not foundInstall perl-Digest:
sudo apt install libdigest-sha-perl2. Extract files: Extract compressed files to the working directory.
tar -xzf elasticsearch-9.0.0-linux-x86_64.tar.gz
cd elasticsearch-9.0.0/
3. Run Elasticsearch: This command is for running Elasticsearch.
./bin/elasticsearchThe first time you run Elasticsearch, it generates security certificates and credentials. Make sure to save these for future use.
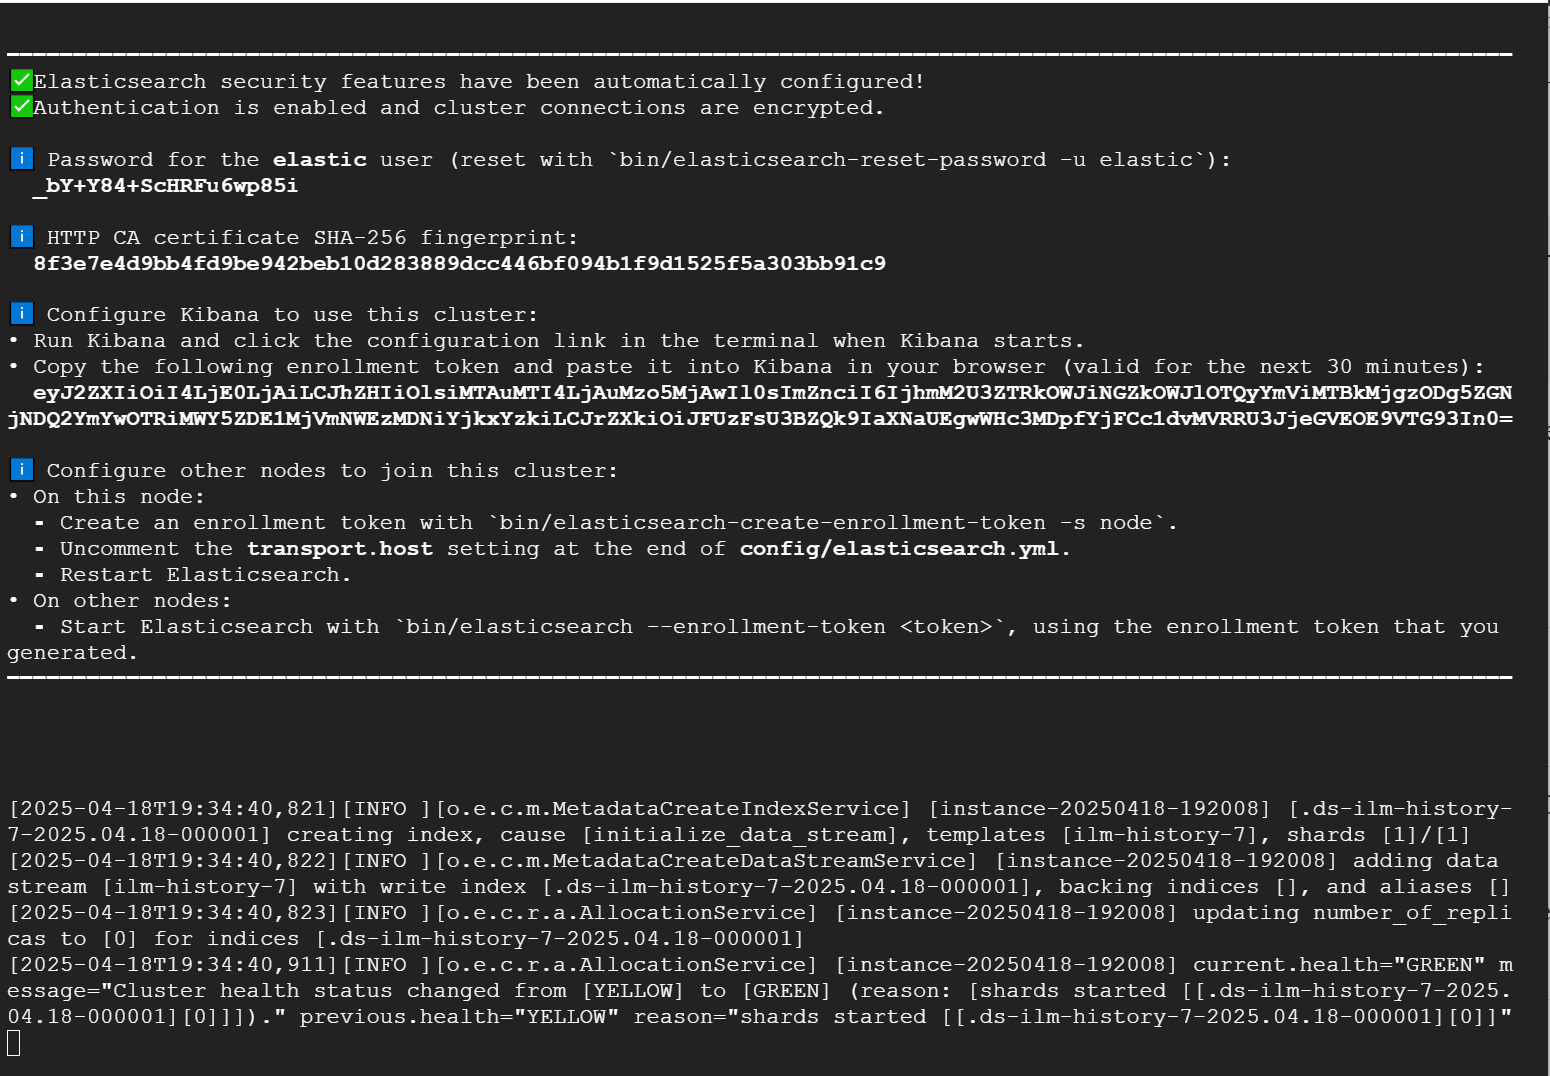
4. Copy the generated password, fingerprint and enrollment token.
5. In a separate terminal from where Elasticsearch is running, navigate to the directory where you installed Elasticsearch and run the elasticsearch-create-enrollment-token tool to generate an enrollment token for your new nodes.
./bin/elasticsearch-create-enrollment-token -s node
In case you want to add new nodes, follow this guide.
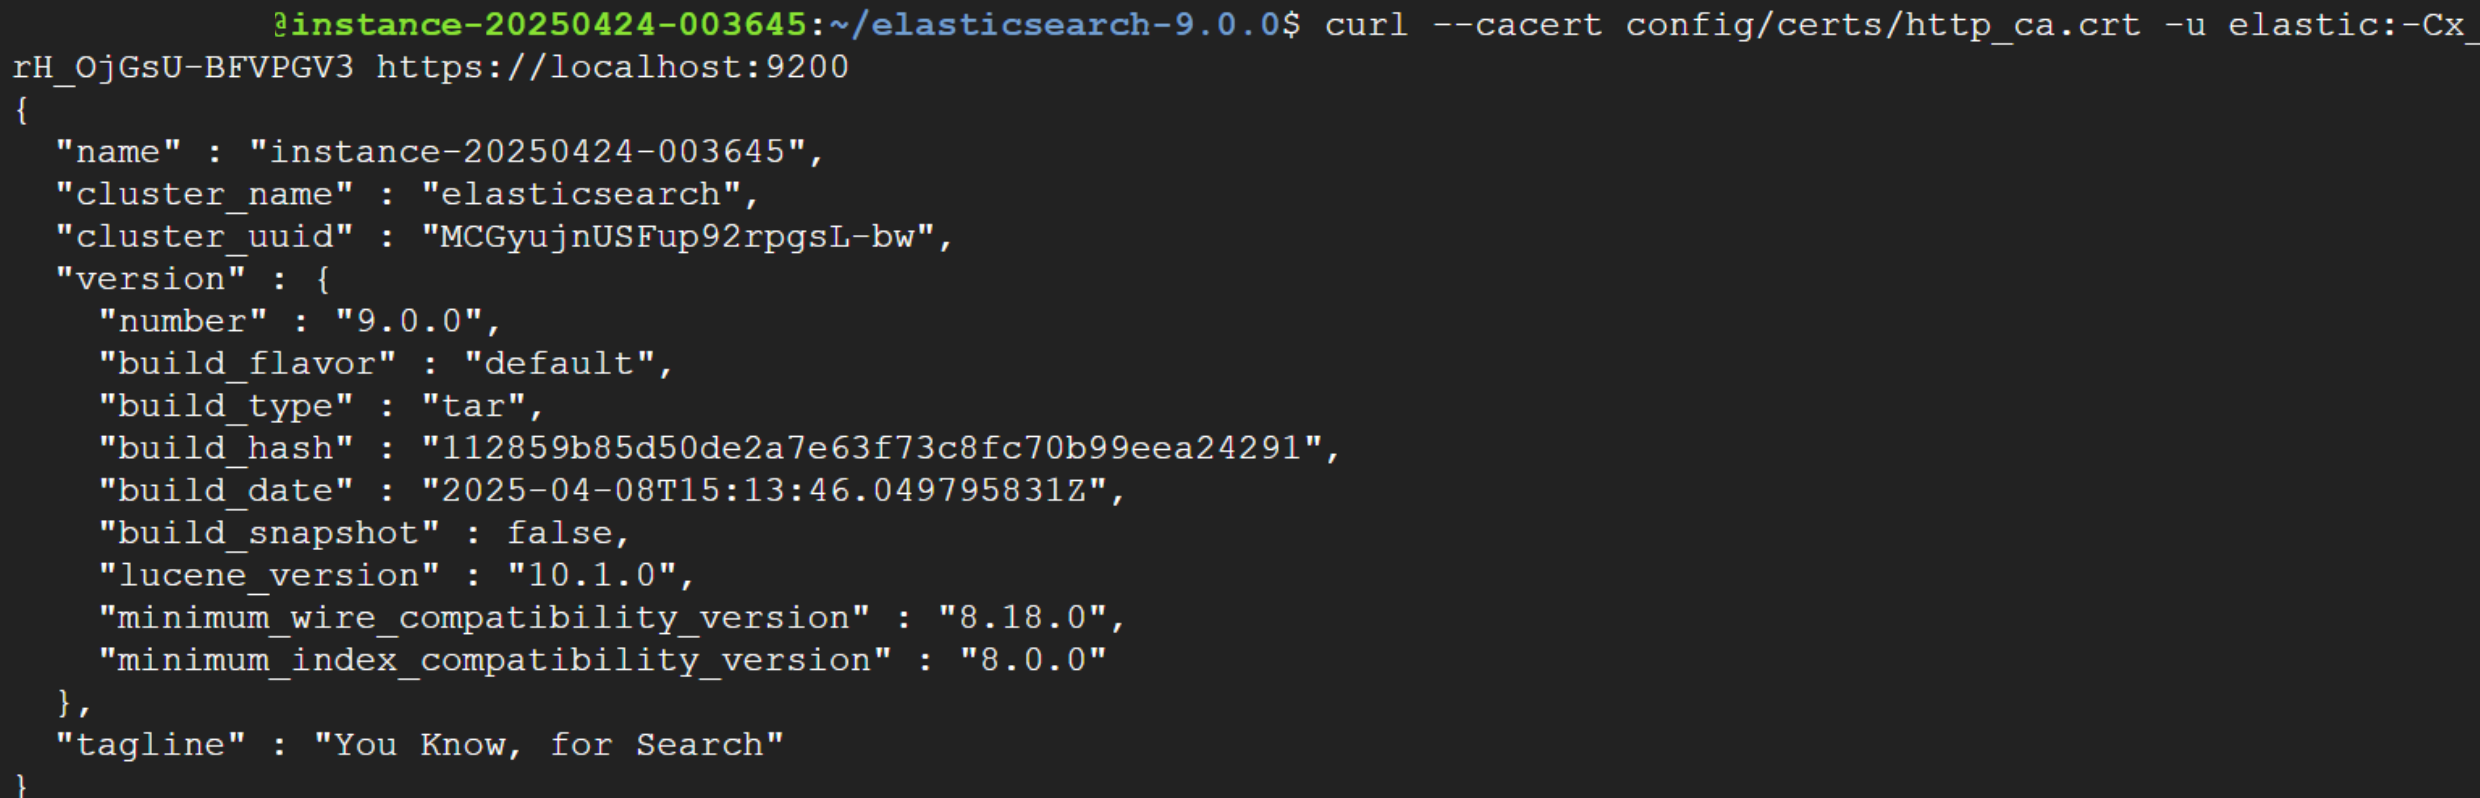
6. Let’s verify Elasticsearch is running:
cd elasticsearch-9.0.0/
curl --cacert config/certs/http_ca.crt -u elastic:$ELASTIC_PASSWORD https://localhost:9200
Replace $ELASTIC_PASSWORD with the generated password from step 3.
Installing Kibana
Kibana is the visualization and analytics dashboard for Elasticsearch, providing an interface to search, view, and interact with data stored in Elasticsearch indices.
Installing Kibana allows you to create visualizations, build dashboards, and manage your Elasticsearch cluster through a user interface.
1. Download and extract Kibana:
curl -O https://artifacts.elastic.co/downloads/kibana/kibana-9.0.0-linux-x86_64.tar.gz
curl https://artifacts.elastic.co/downloads/kibana/kibana-9.0.0-linux-x86_64.tar.gz.sha512 | shasum -a 512 -c -
tar -xzf kibana-9.0.0-linux-x86_64.tar.gz
cd kibana-9.0.0/
For production environments, consider installing Kibana on a separate instance. Here we're installing it on the same instance for simplicity.
2. In order to access Kibana from the internet, we’re going to configure the kibana.yaml file:
nano ./config/kibana.ymlLook for the server.host setting and set it to:
server.host: "0.0.0.0"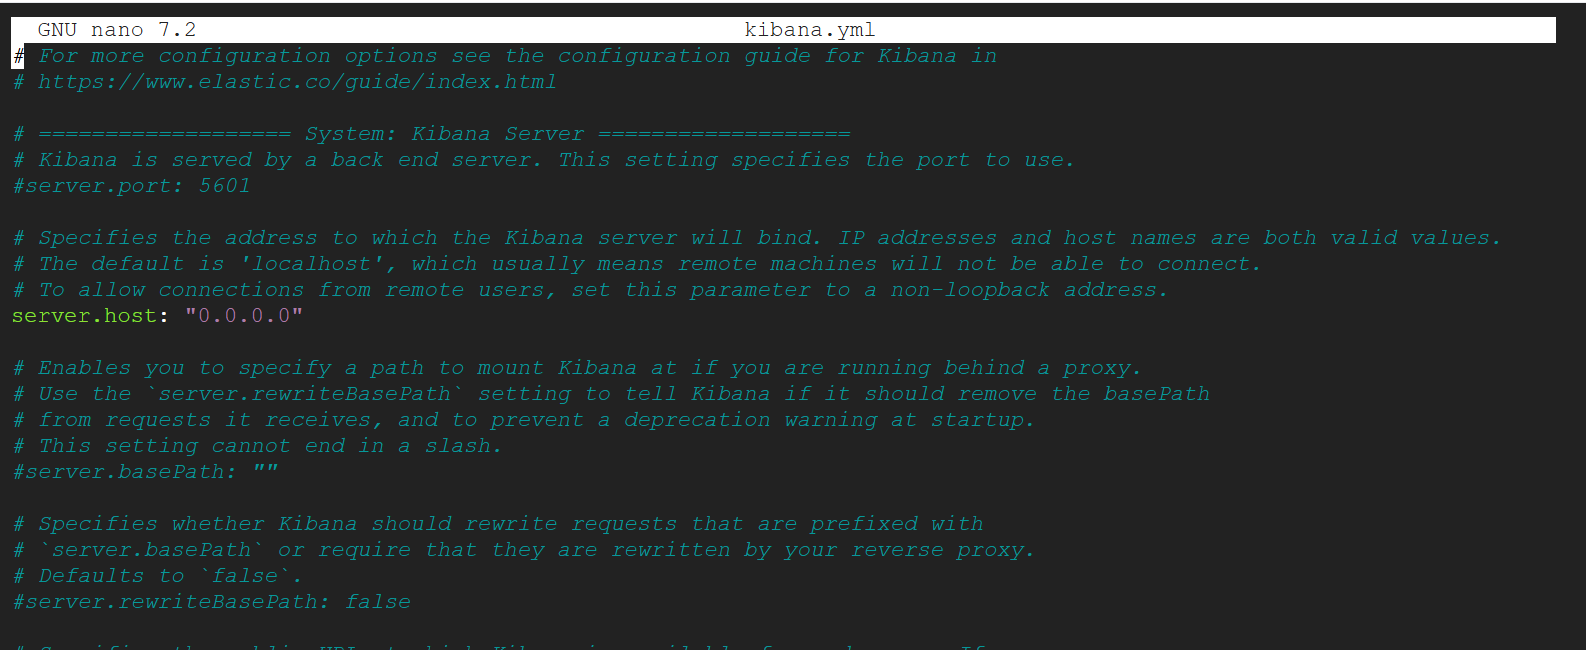
Exit and save.
3. Run Kibana:
./bin/kibana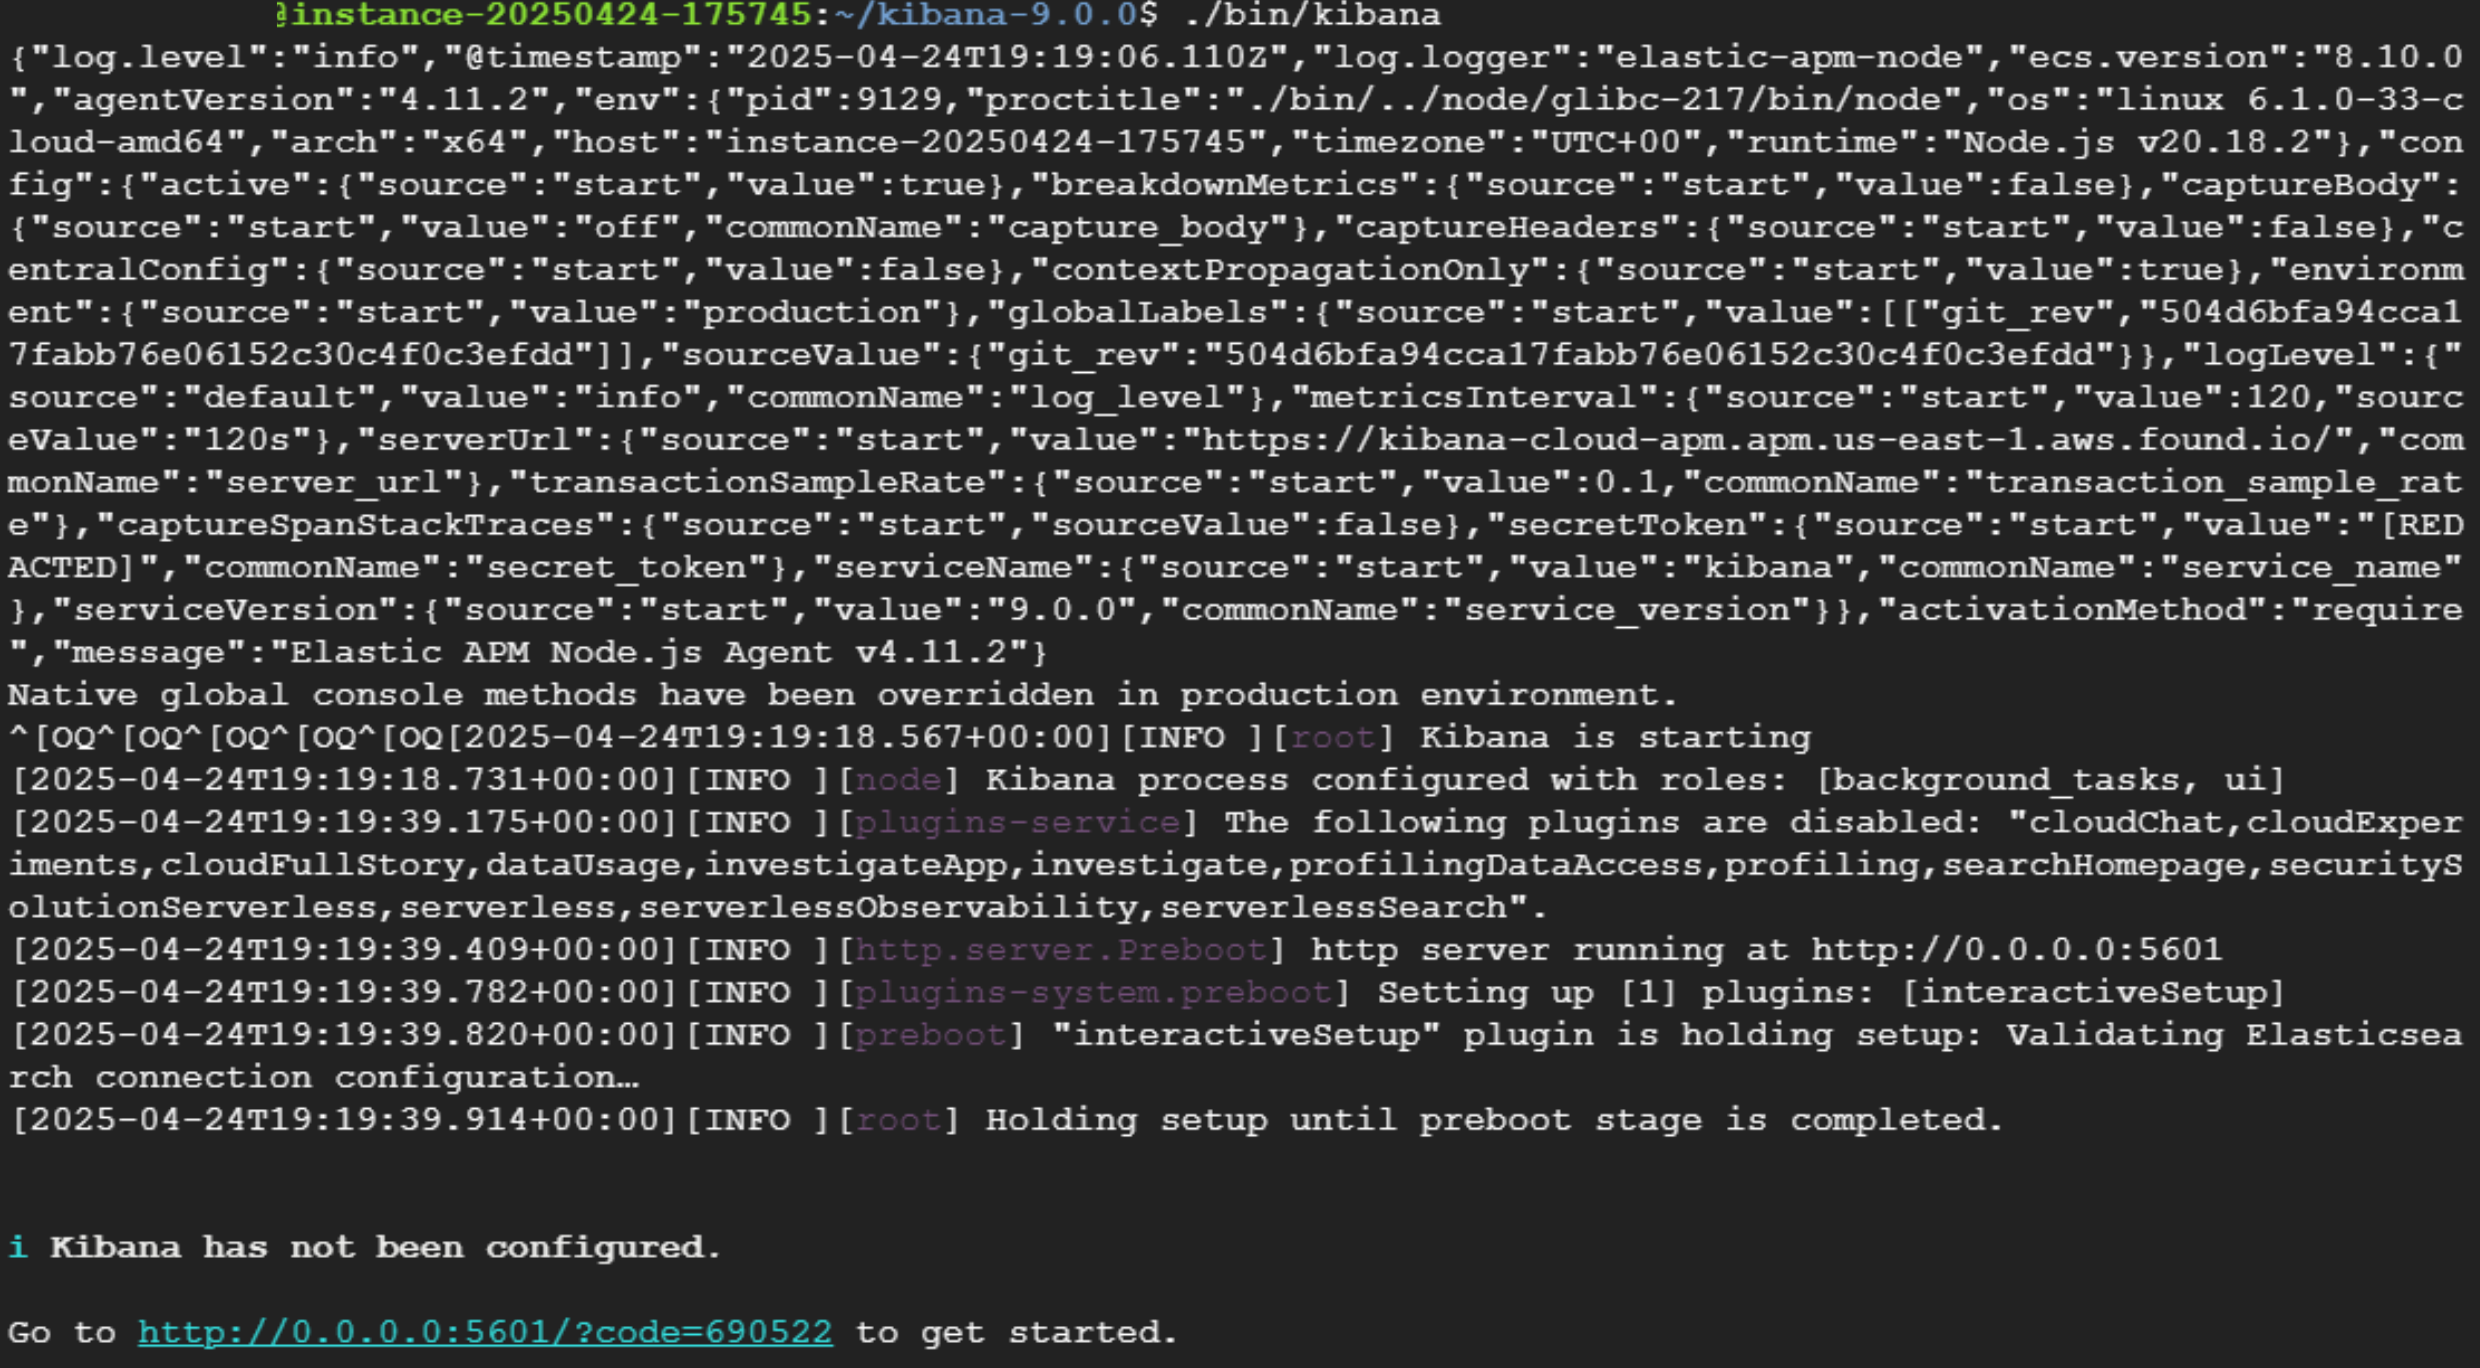
4. Access from browser to VM instance public IP address with this format: Public IP Address can be found on step 12 of Setting up a Virtual machine Instance.
http://{VM-IP-ADDR}:5601/?code=5678925. Paste the Kibana enrollment token from step 4 of Installing Elasticsearch when prompted.
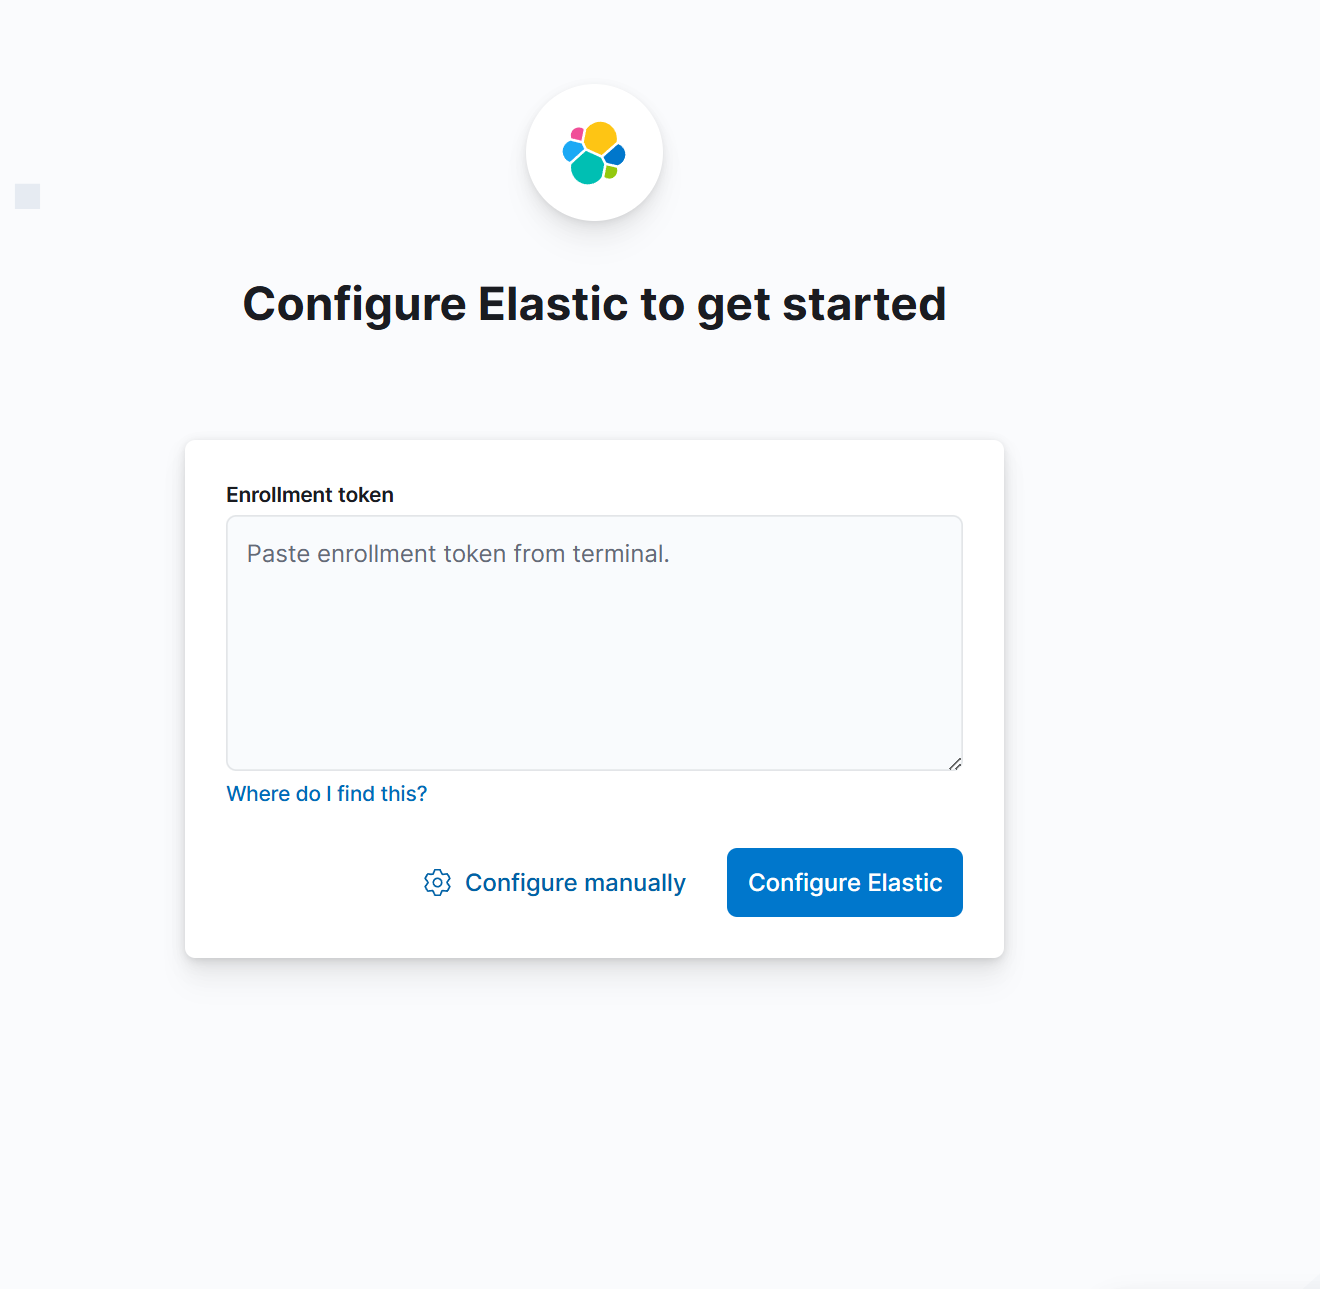
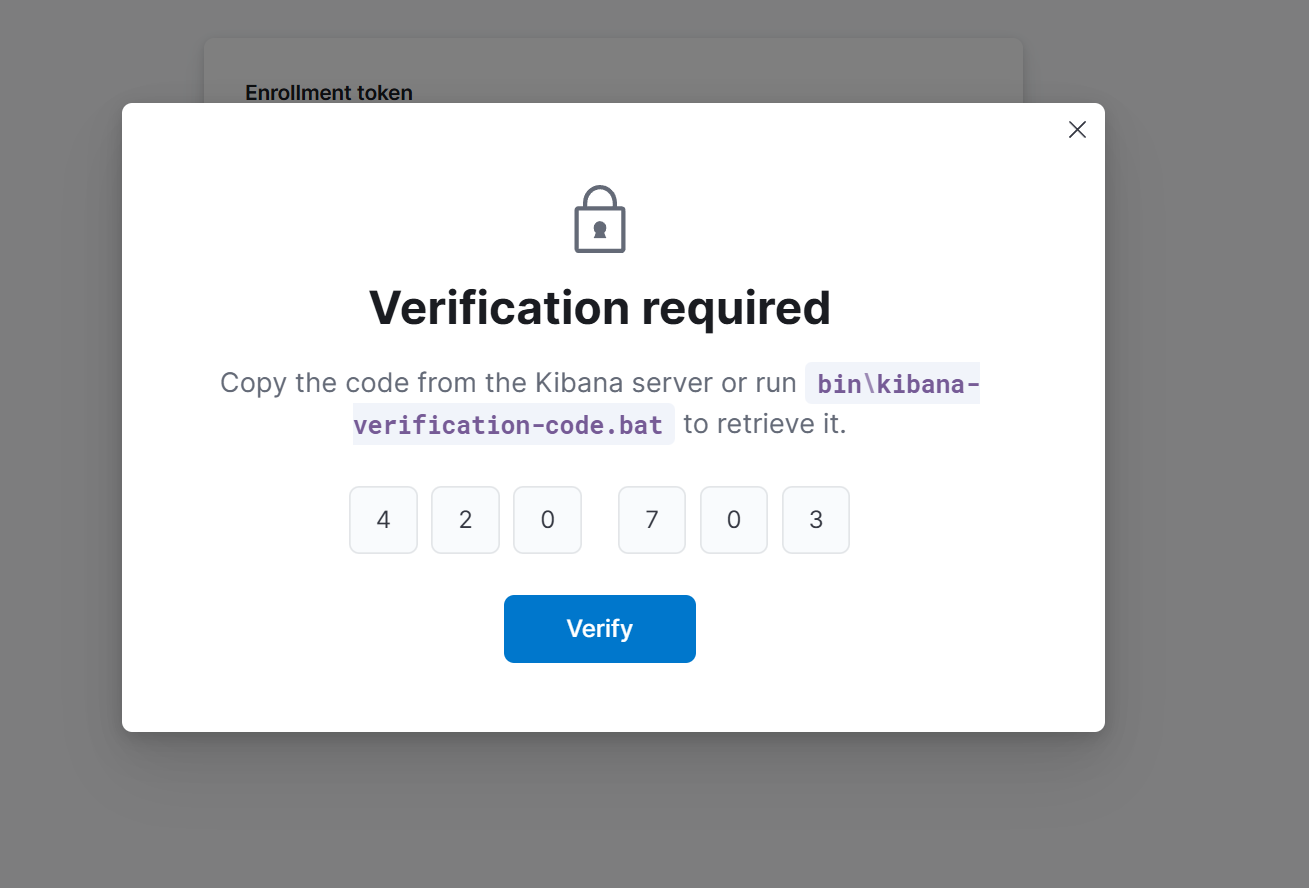
6. When prompted, you get a verification from your Kibana server. Go to the Kibana SSH Window.
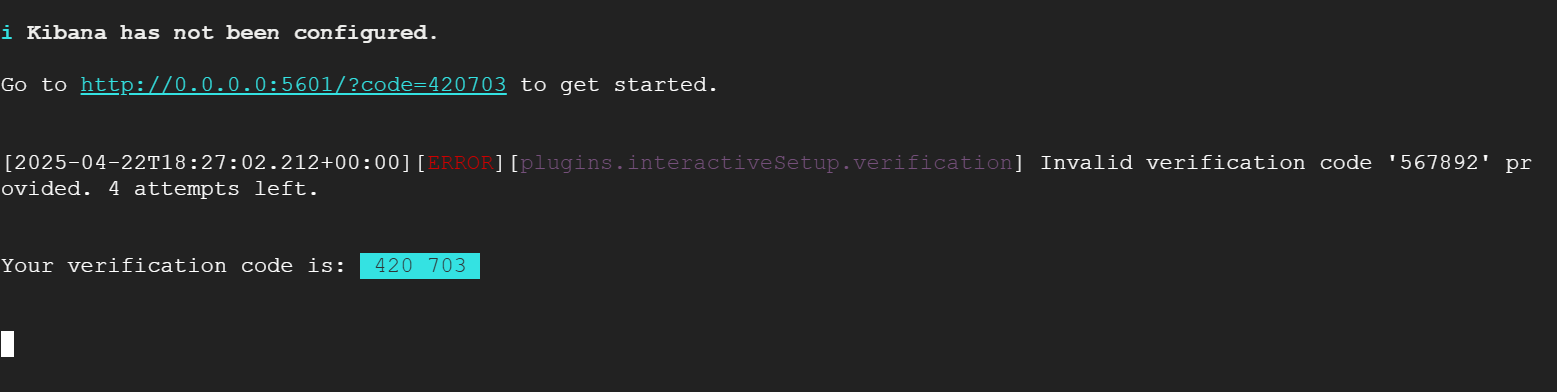
And paste the verification code in the Verification modal. Then click Verify.
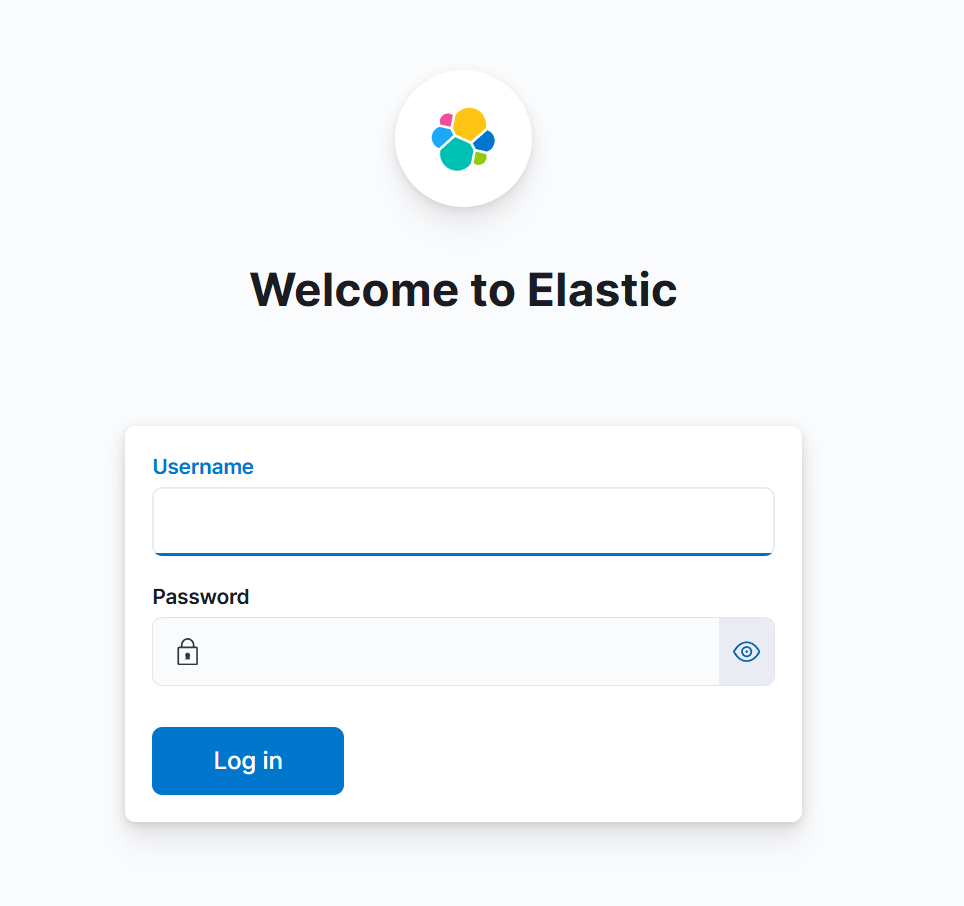
7. Enter the Elasticsearch username and password. Input the user and password from step 4 of Installing Elasticsearch.
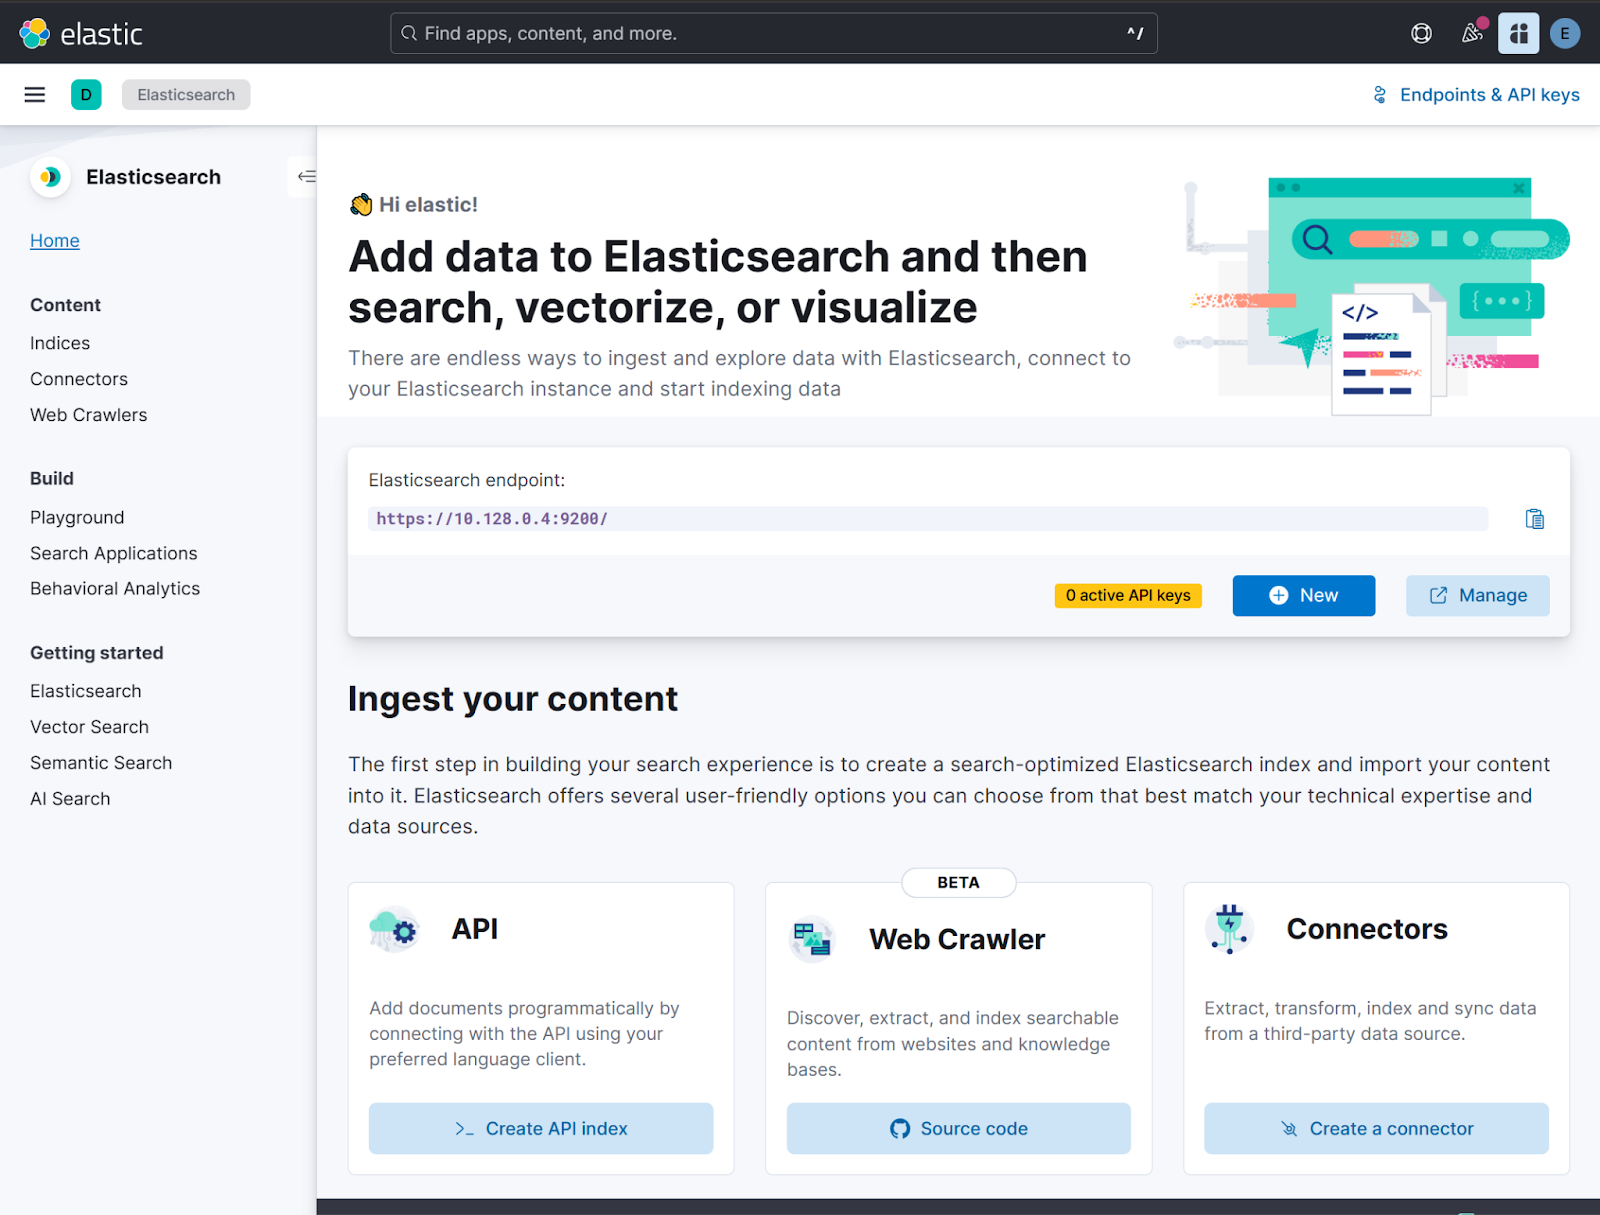
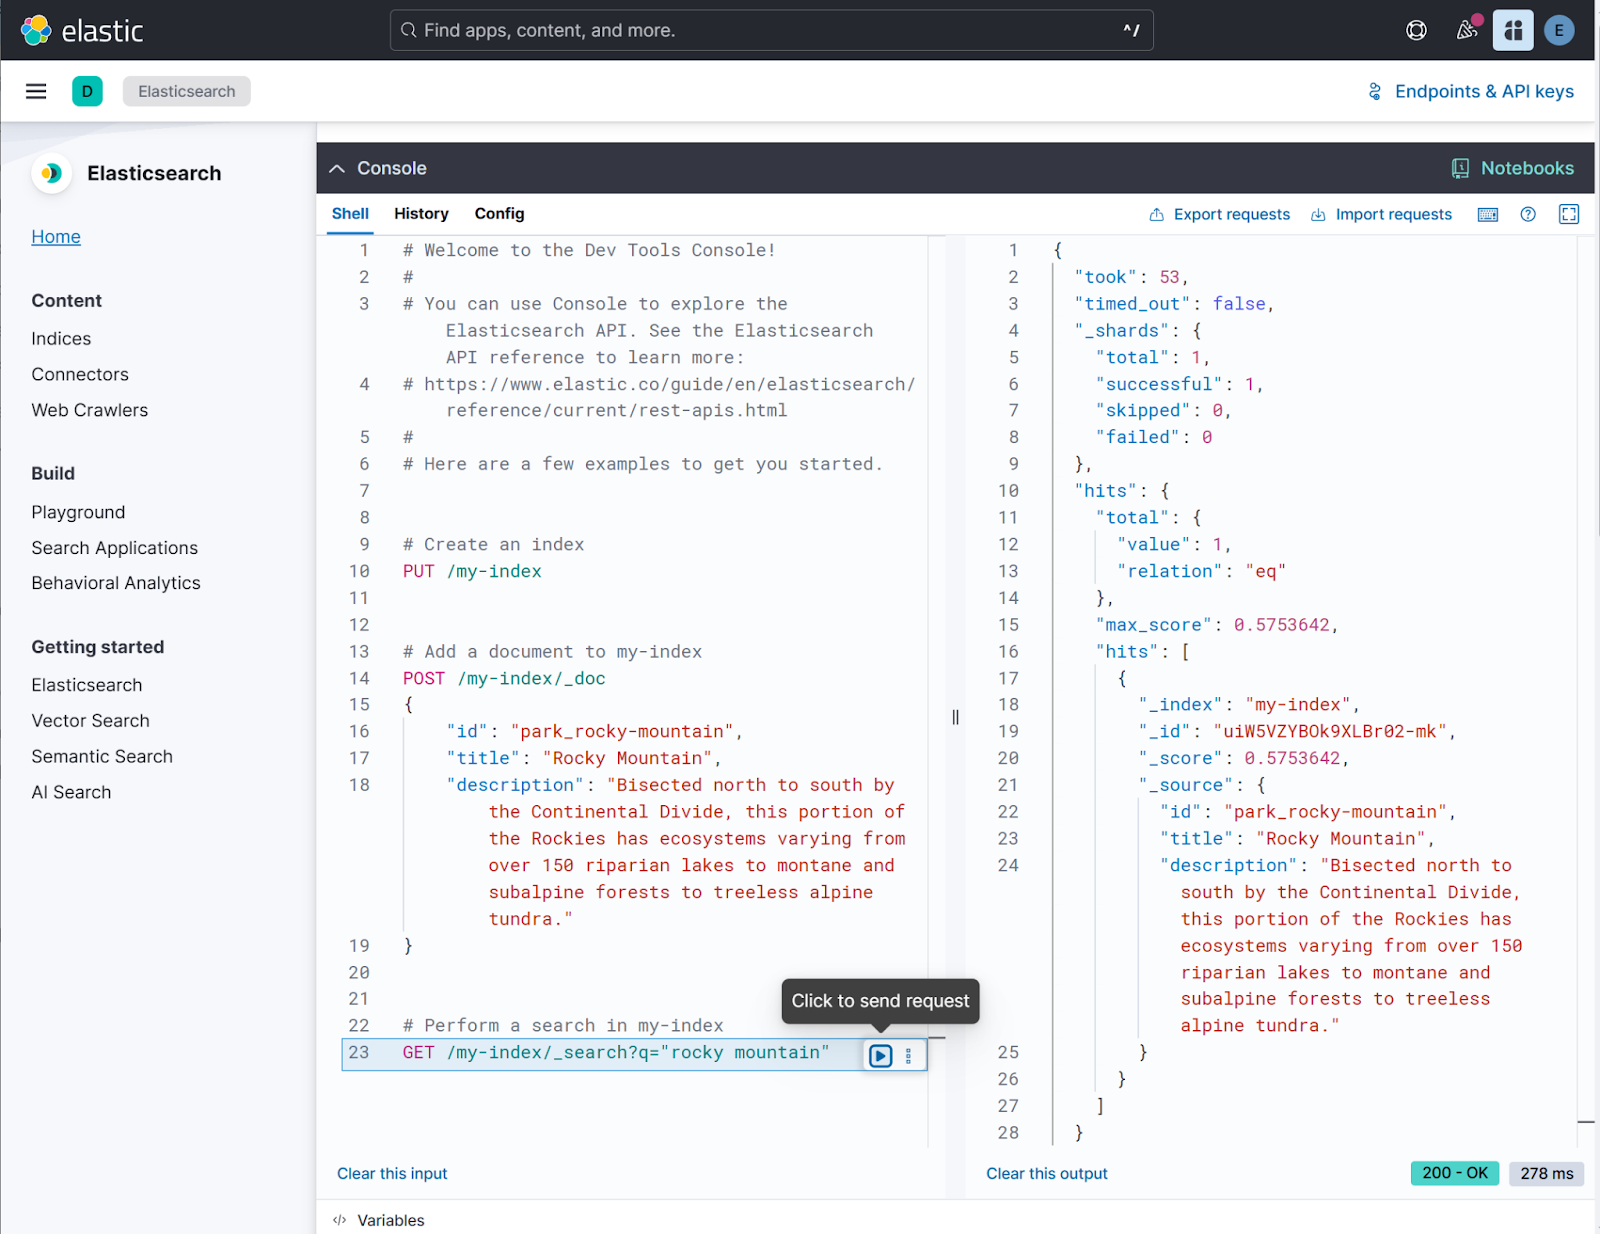
Kibana installation is complete!
After completing these steps, you'll have a working Elasticsearch deployment with Kibana running on GCP Compute Engine VM instances. This setup gives you full control over your environment while leveraging GCP infrastructure.
Next Steps
Consider implementing the following for production environments:
- Configure systemd services for automatic startup
- Implement a multi-node cluster for high availability
- Configure snapshot repositories for backups
Ready to try this out on your own? Start a free trial.
Want to get Elastic certified? Find out when the next Elasticsearch Engineer training is running!
Related content
September 5, 2025
Running cloud-native Elasticsearch with ECK
Learn how to provision a GKE cluster with Terraform and run the Elastic Stack on Kubernetes using ECK.
September 1, 2025
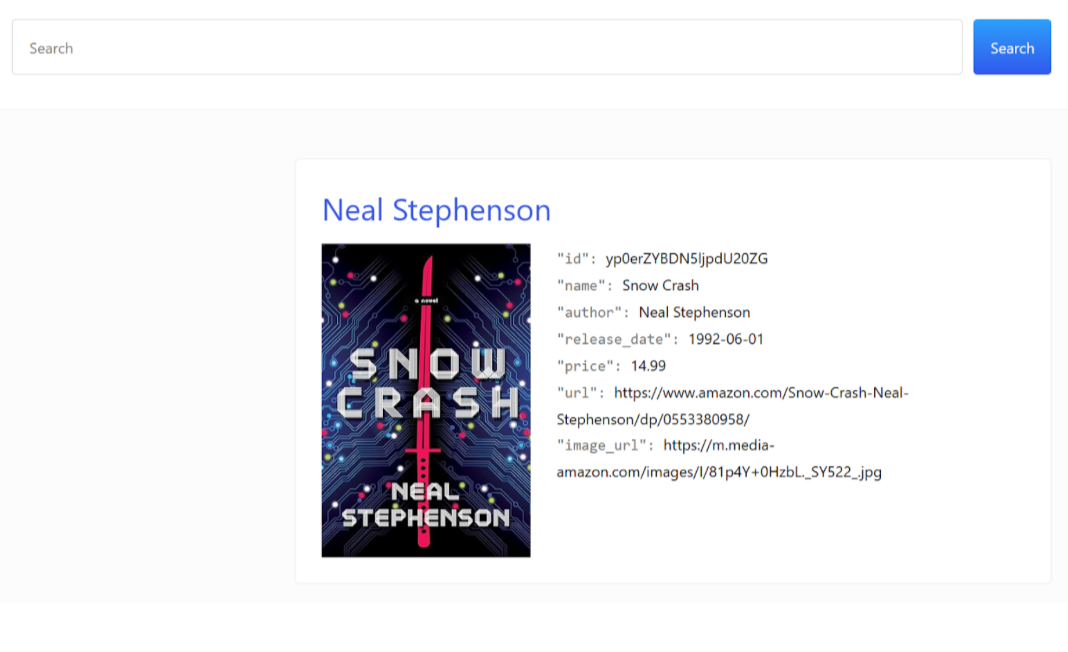
Using UBI in Elasticsearch: Creating an app with UBI and search-ui
Learn how to use UBI in Elasticsearch through a practical example. We’ll be creating an application that produces UBI events on search and click results.
August 13, 2025
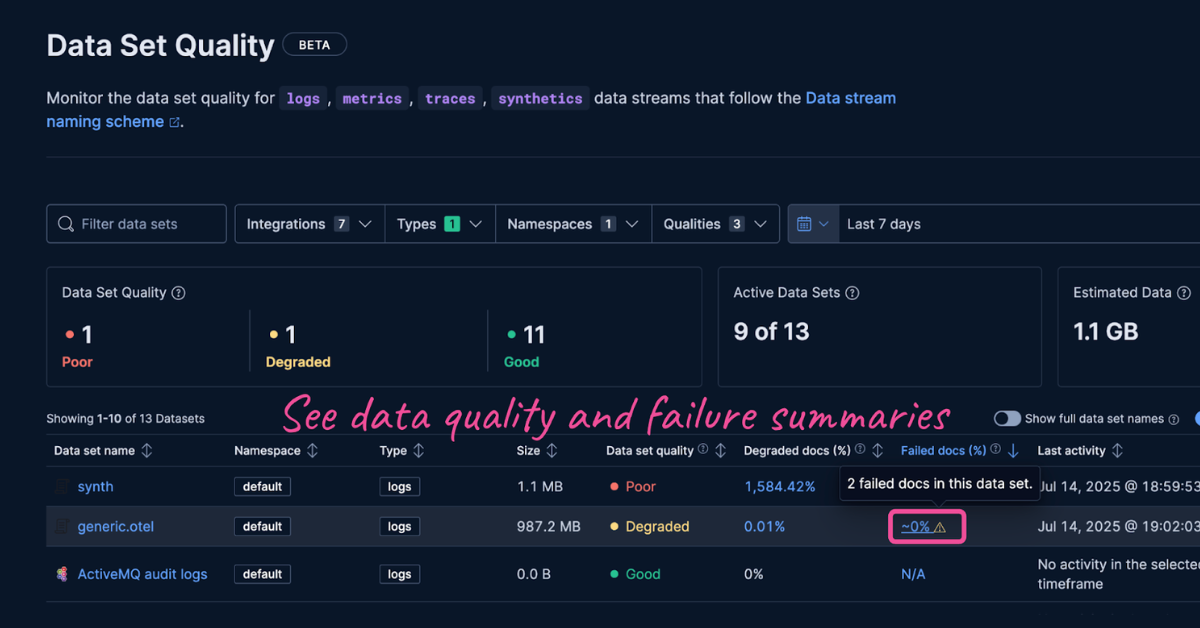
Failure store: see what didn’t make it
Learn about failure store, a new feature in the Elastic Stack that captures and indexes previously lost events.

August 14, 2025
Elasticsearch shards and replicas: A practical guide
Master the concepts of Elasticsearch shards and replicas and learn how to optimize them.

August 4, 2025
Working with your App Search data in a post Enterprise Search world
With Enterprise Search decommissioned in the Elastic Stack version 9, you can still work with your existing App Search data—we’ll show you how.